

Photo by Soonios Pro from Pexels
Introduction
in this article, we will build the cornerstone service of our reference implementation application, The Configuration Service. As we discussed in the previous article on Microservice Configuration, we will centralize all of our application services configurations using the Configuration Service.Understanding layered configuration
With Spring services, our configuration is built up from multiple sources. Each subsequent source overlays the previous source, adding or updating the configuration parameters. When all sources have been applied the configuration will be the union of all configuration sources. Spring supports both properties and yml files. We choose to use yml, which in our opinion is easier to read. Our service's configuration sources include:- bootstrap.yml-In Spring Cloud applications, bootstrap.yml is loaded first. This configures the Service Name and the ConfigurationService parameters.
- application.yml-The application.yml provides the service-specific default configuration.
- ConfigurationService config file-This configuration file (detailed below), overrides the service's default configuration with any application-specific parameters (e.g., database connection information, connection credentials, etc)
- command line parameters-When the application is invoked, its command line parameters will override any previously declared values. To disable this feature add the following to your Configuration Services bootstrap.yml file: spring.cloud.config.override-system-properties=false.
- environment variables-The final layer are environment variables. By setting corresponding environment variable we are able to override the configuration based on the deployment location. We will take advantage of this when we begin using Docker-Compose to orchestrate our services.
Requirements
Before you get started, you will need the following:- Java
- Maven
- Docker
- Docker-Compose
Building the Configuration Service
The Configuration Service is one of the simplest services in our application. The heavy lifting is being handled by the Cloud Config Server, which provides the configuration services functionality. To build out the Configuration Service, we first build our project file.Maven POM.XML
Our Configuration Service's project file is described here:loading...The key features with the pom.xml are the inclusion of:
- spring-boot-starter-parent- which brings in the base spring dependencies.
- spring-cloud-config-server- which brings in the base spring cloud config server dependencies.
- logstash-logback-encode- which provides a logging appender that supports JSON log formatting.
- spring-boot-maven-plugin- which extends Maven with spring-boot specific goals (e.g., run, uber-jar).
- dockerfile-maven-plugin- which extends Maven with the ability to process a Dockerfile to create a corresponding Docker Image.
The Source
The Configuration Service can be realized in 11 lines of code (ok...15 if you count blank lines):loading...The application code is made up of a single Spring Boot application class. As mentioned earlier, the heavy lifting is performed by Spring Cloud Config through the single @EnableConfigServer annotation. Everything else is managed by the services configuration files.
loading...Here we define the security credentials, the server port, and where we will search for our configurations ( classpath:/config).
Service Metrics and Monitoring
In the earlier article Microservice Monitoring, we mentioned the William Thompson (Lord Kelvin) quote "When you can measure what you are speaking about, and express it in numbers, you know something about it...". Here he introduce our approach to fullfilling that mandate.Spring Actuator
The first step in our journey to metric collection and monitoring starts with Spring Actuator. Spring Actuator is a library that provides Spring Boot services with "production-ready" support for monitoring and management. Here we focus on the monitoring aspects. With the simple inclusion of the Spring Actuator dependency and a few lines of configuration, Spring Actuator creates a monitoring endpoint for our Spring Boot that can be polled by an external service to monitor the state of the service.Micrometer
While Spring Actuator provides us a monitoring endpoint, what it provides us is a Spring-centric representation of our metrics. This may be sufficient if you are planning to build your own external monitoring service but our plan is to leverage Prometheus's monitoring features to collect our metrics and it would be advantageous if the monitoring endpoint data was rendered in a Prometheus-ready format... enter Micrometer. Micrometer provides us with a "vendor-neutral application metrics facade". It does for our metrics what slf4j does for logging. As if that wasn't enough, it accomplishes this the same way Spring Actuator does- by adding an additional library dependency, and an addition to the application.yaml configuration file.To add Spring Actuator and Micrometer support, simply add the following dependencies to your project:
		<dependency>
		<groupId>org.springframework.boot</groupId>
		<artifactId>spring-boot-starter-actuator</artifactId>
		</dependency>
		<dependency>
		<groupId>io.micrometer</groupId>
		<artifactId>micrometer-registry-prometheus</artifactId>
		<version>1.1.2</version>
		</dependency>
Now to configure your service to expose a Prometheus-ready endpoint, add the following to your application.yaml configuration file.
		management:
		endpoints:
		enabled-by-default: true
		metrics:
		sensitive: false
		web:
		exposure:
		include: info,health,prometheus
Prometheus
Now that we our metrics are ready to be consumed by Prometheus, we need to stand up an instance. To do this we will add a new service to our Docker-Compose file.
		###############
		# prometheus  #
		###############

		prometheus:
		image: prom/prometheus:latest
		volumes:
		- ./prometheus.yml:/etc/prometheus/prometheus.yml
		- ./rules.yml:/etc/prometheus/rules.yml
		ports:
		- 9090:9090
		restart: always
		networks:
		- spring_ri_network
		# think microservices global config
		global:
		scrape_interval:     15s # Set the scrape interval to every 15 seconds. Default is every 1 minute.
		evaluation_interval: 15s # Evaluate rules every 15 seconds. The default is every 1 minute.
		# scrape_timeout is set to the global default (10s).

		# Our scrape configuration containing will configure Prometheus to scape its own metrics as well
		# as the Config-Service's metrics:

		scrape_configs:

		###############
		# prometheus  #
		###############

		- job_name: 'prometheus'

		# metrics_path defaults to '/metrics'
		# scheme defaults to 'http'.

		static_configs:
		- targets: ['localhost:9090']

		##################
		# config service #
		##################

		- job_name: "config-service"
		metrics_path: "/actuator/prometheus"
		basic_auth:
		username: 'think'
		password: 'microservices'
		scrape_interval: 5s
		static_configs:
		- targets: ['config-service:8888']
When the Prometheus instance starts up, it will begin scraping the two configured service endpoints (Prometheus & Config-service) periodically based on the value of the scrape_interval. This data is then added to Prometheus' database.
Grafana
Now that we have captured our service's metrics, it would be great if we had a tool to visualize our data. As luck would have it, we have just such a tool with Grafana. Grafana makes the process of visualizing the Configuration-Service's metrics painless. To do so we have two simple operations: stand up and instance of Grafana, and create the create a dashboard.As with our Prometheus instance, we will add another service to our Docker-Compose file:
		###########
		# grafana #
		###########

		grafana:
		image: grafana/grafana
		ports:
		- 3000:3000
		volumes:
		- ./datasource.yml:/etc/grafana/provisioning/datasources/datasource.yml
		depends_on:
		- prometheus

		environment:
		- GF_SECURITY_ADMIN_USER=admin
		- GF_SECURITY_ADMIN_PASSWORD=admin
		networks:
		- spring_ri_network
Service Configuration
The Spring Cloud Config Server provides for various configuration location sources including, resource files, Git repository, and a HashiCorp Vault instance. To keep things simple we will start by using the service's local resource path to store our configuration files.We will be storing our other service configuration files in the configuration services resource/config directory. The naming format is in the form:
service-name - dev | stage | prod .yml
where:
- service-name- is the services name as defined in its local bootstrap.yml file
- dev|stage|prod- is the execution profile the service will be running in.
Note: Each service expects a configuration named configuration.source. If theoutput of the service displays configuration.source=CONFIGURATION-SERVICE, the server is reading its configuration from the Configuration Service. Otherwise, it will display configuration.source=DEFAULT
Orchestrating The Configuration Service and Unified Logging
The Configuration Service, by itself, doesn't do much. It starts up and waits for other services to query it for their configuration. If we run it from its jar file, we will see it logs to stdout. However, this is part of a microservice application, so we will create a Docker file and redirect the stdout to Fluentd ,which will transport the log events to our Elasticsearch server, which indexes the log events for access by Kibana or via Elasticsearch's REST API.Docker file
To create our Docker container, we must create a Dockerfile that describes the container's contents.loading...Here we define the security credentials, the server port, and where we will search for our configurations ( classpath:/config).
Fluentd
As mentioned in previous articles, we will be using fluentd to capture and transport our stdout log events and send them to our Elasticsearch server. To do this, we will need to create a Fluent Dockerfile that we will wire our service to.Fluent Dockerfile
We will be creating a fluentd container that will be used by all our services. To create it, we will need a Dockerfile and a configuration file. We will start with the default:FROM fluent/fluentd:v1.6-debian-1.
loading...Now we configure it to point to the Elasticsearch server and prefix the log with fluentd
loading...The logstash_prefix fluentd defines the prefix we will use later to query Elasticsearch.
Elasticsearch
We will be using Elasticsearch to aggregate the output logs from each of our services. Rather than performing a traditional install of Elasticsearch, we will leverage power of containerization to provide our instance. Using an Official Docker Image from DockerHub as our image source we can be sure we are using an unadulterated instance of Elasticsearch.Kibana
We will be using Kibana as the web front-end to Elasticsearch. As with our Elasticsearch instance, we will also use an Official Docker Image from DockerHub.Prometheus
We will gather and store our application metrics using an Official Docker Image of Prometheus from DockerHub.Grafana
We will use Grafana as the front end for our Prometheusinstance. We will use an Official Docker Image from DockerHub.Docker-Compose
Now we will pull everything together in our Docker-Compose file which will startup our Elasticsearch, Fluentd, Kibana, and Configuration Service.loading...Our Docker-Compose file declares six services:
- Elasticsearch-we declare the container image, pass in "discovery.type=single-node" via the environment variable, expose the server port 9200, and attach the service to the spring_ri_network
- Kibana-we declare the container image, declare a link to elasticsearch, expose the server port 5601, and attach the service to the spring_ri_network. We also add a service dependency to elasticsearch.
- Prometheus-we declare the container image, configure our container volumes, expose the server port 9090, and attach the service to the spring_ri_network
- Grafana-we declare the container image, configure the container volumes, expose the server port 3000, and attach the service to the spring_ri_network. We can optionally configure the web application admin user and password by configuring the container's GF_SECURITY_ADMIN_USER & GF_SECURITY_ADMIN_PASSWORD environment variables.
- fluentd-we declare the container image, declare a link to elasticsearch, expose the server port 5601, and attach the service to the spring_ri_network. We also add a service dependency to elasticsearch
- config-service-we declare the container image, declare a link to fluentd, expose the server port 8888, and attach the service to the spring_ri_network. We add a service dependency to elasticsearch,fluentd, and kibana. Finally, we configure the containers logger to point to the fluentd driver, pass in the fluentd address, and tag the name of the events to configuration.svc
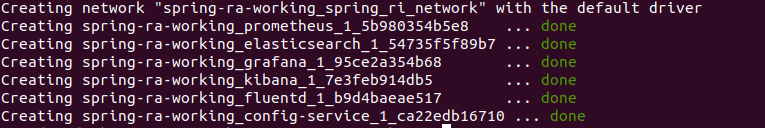
To startup this service simply copy the Docker-Compose file to your machine and run:
docker-compose -f ./dc-01-config.yml up -d
Docker-Compose will start each of the services.
After all the services start (this may take some time) you can navigate to the Kibana instance and query the config service at http://localhost:5601
The first time you run Kibana, you will need to select an index for it to search:
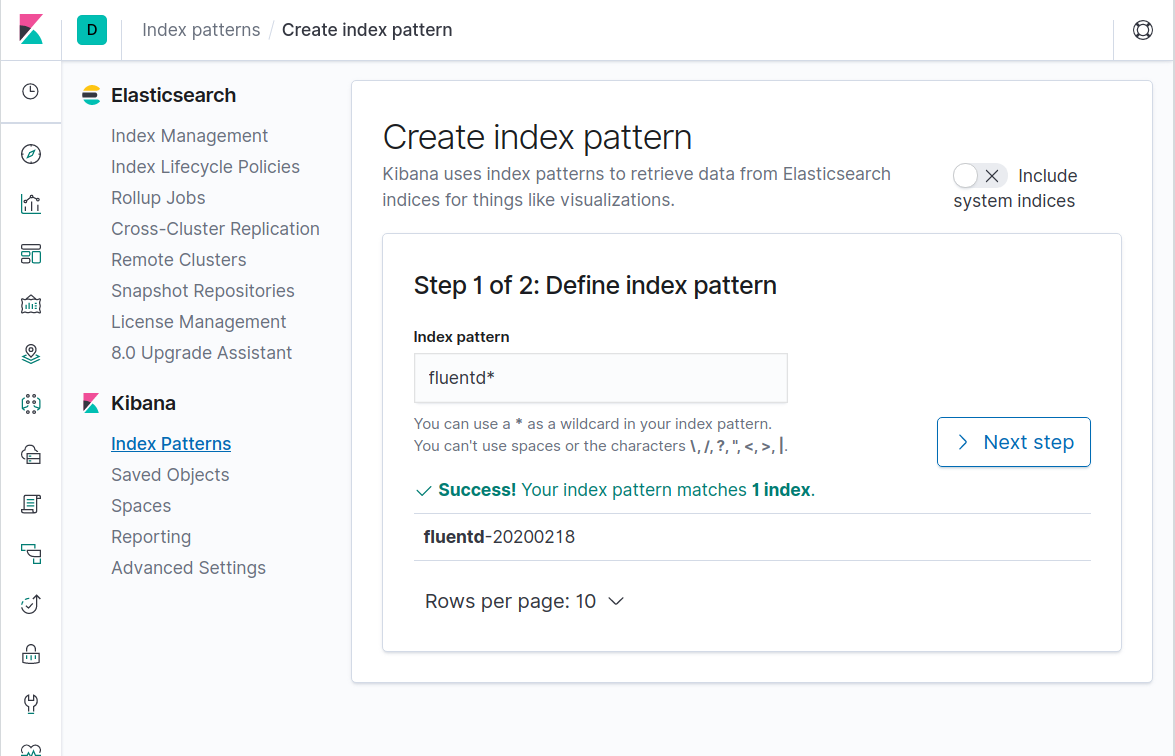
Then select @timestamp
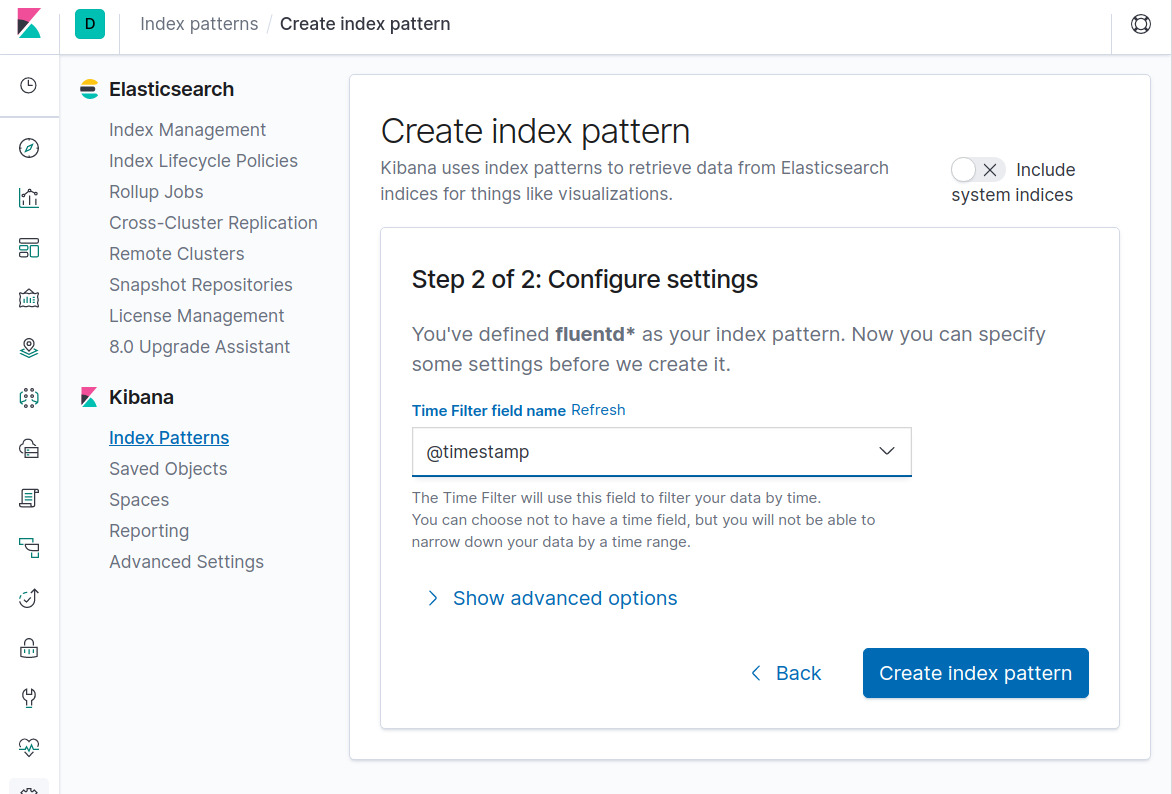
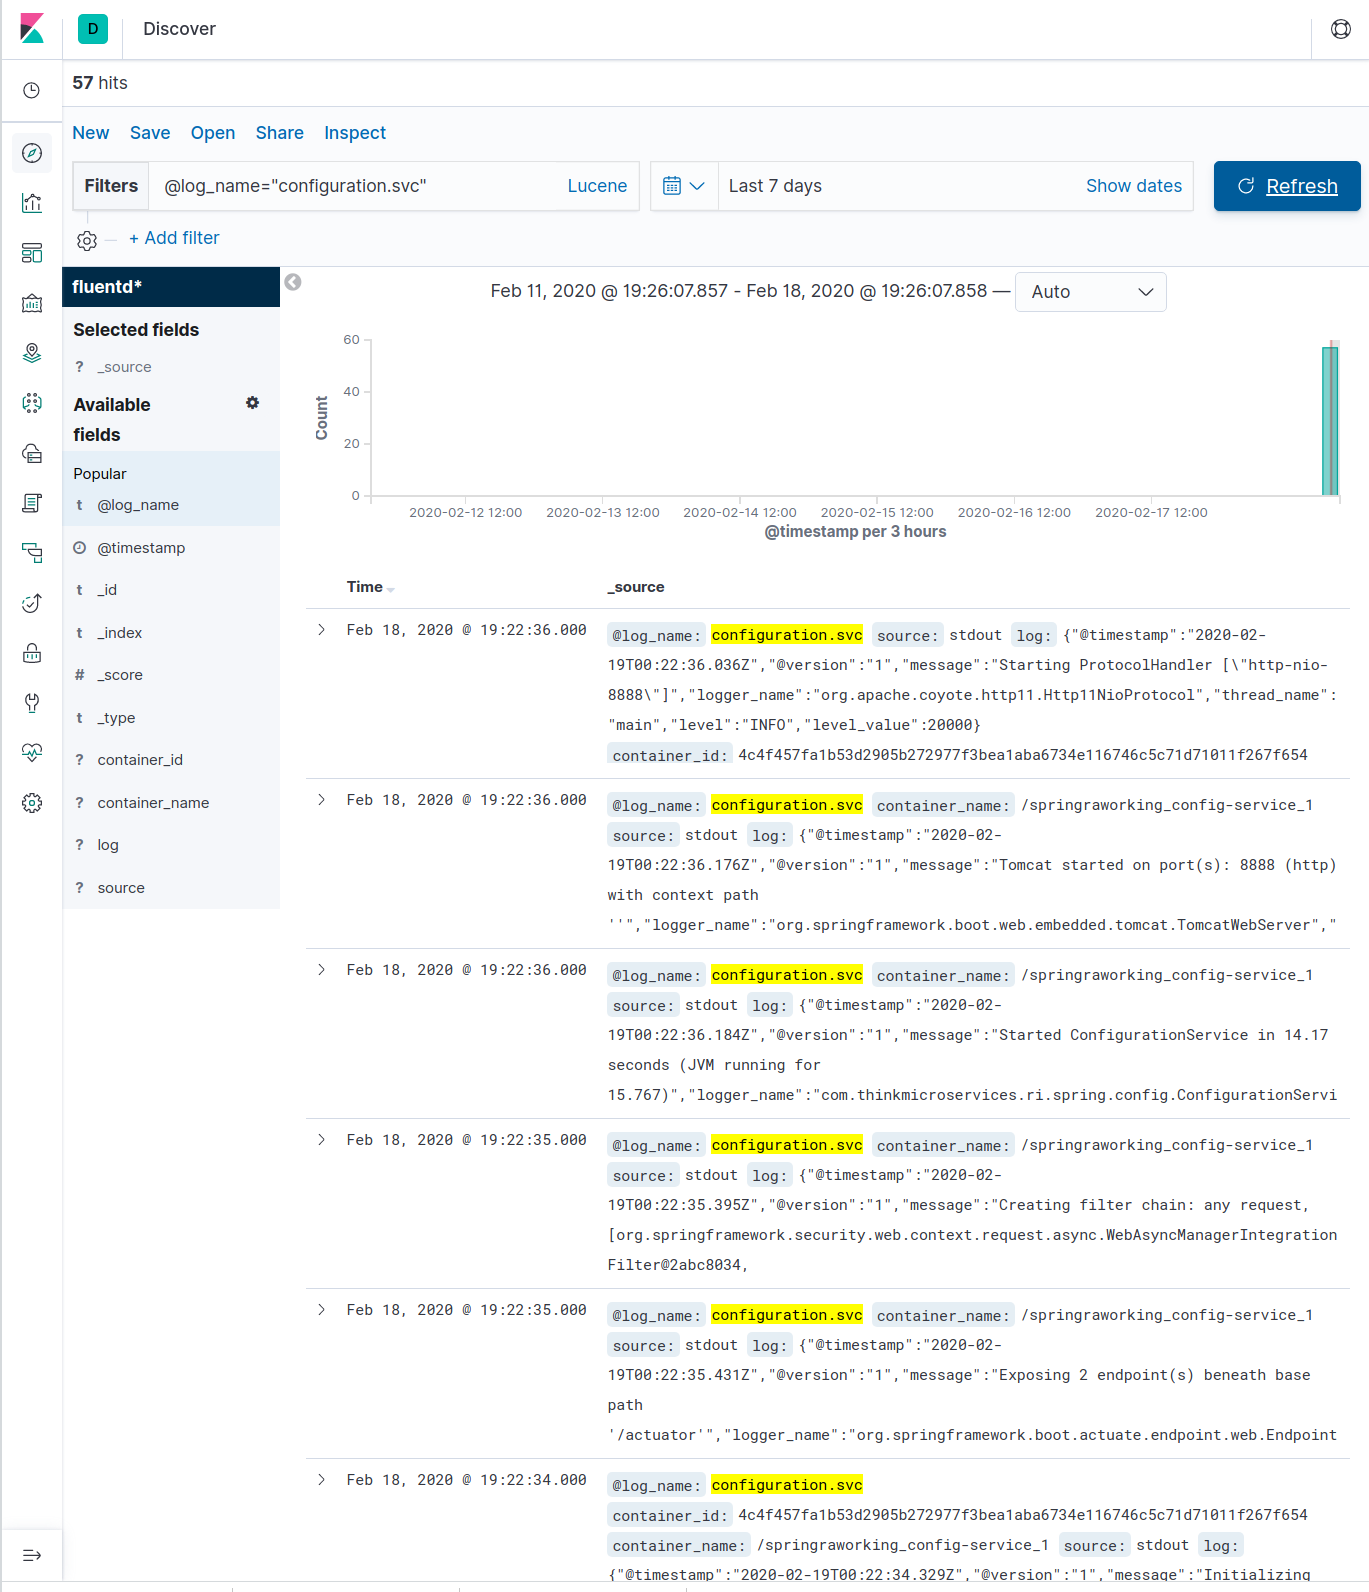
then search for @log_name="configuration.svc"
Viewing Metrics
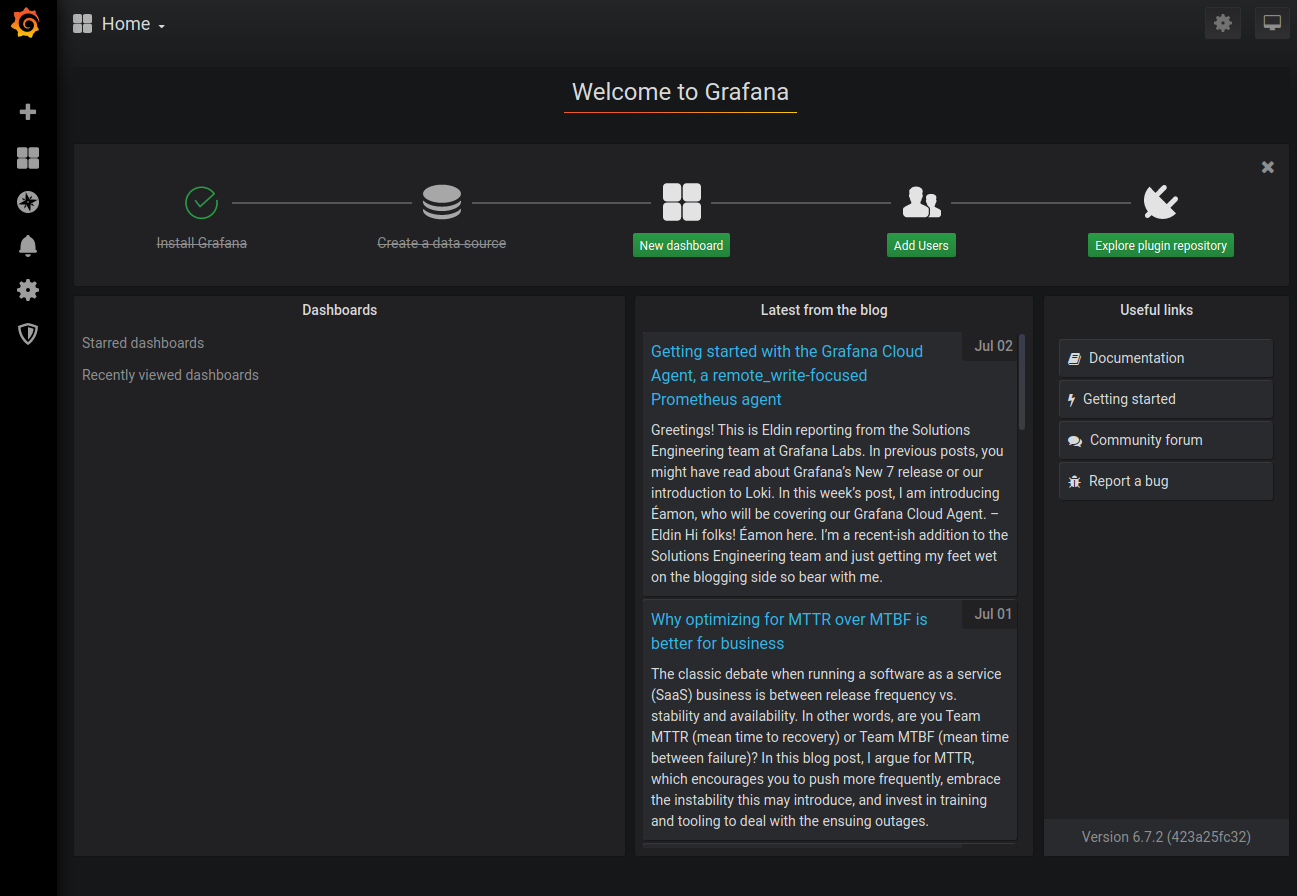
In addition to service logging, our Docker-Compose file Once the service has started, open a browser to http://localhost:3000. It should look like:
We can use the credentials we passed into the service using the environment variables GF_SECURITY_ADMIN_USER GF_SECURITY_ADMIN_PASSWORD. The next page will ask you to change your password. You can skip this as the credentials will be reset the next time you restart Grafana. Once logged in you should see the main page.
While we didn't create any custom metrics for our Configuration-Service, we still have a wealth of metrics being generated from our JVM. We will import the pre-created Micrometer JVM Dashboard from the Grafana Labs web site. This prebuilt dashboard will be used to monitor each of our service JVMs .
Import the Grafana JVM Micrometer dashboard
First we must select import: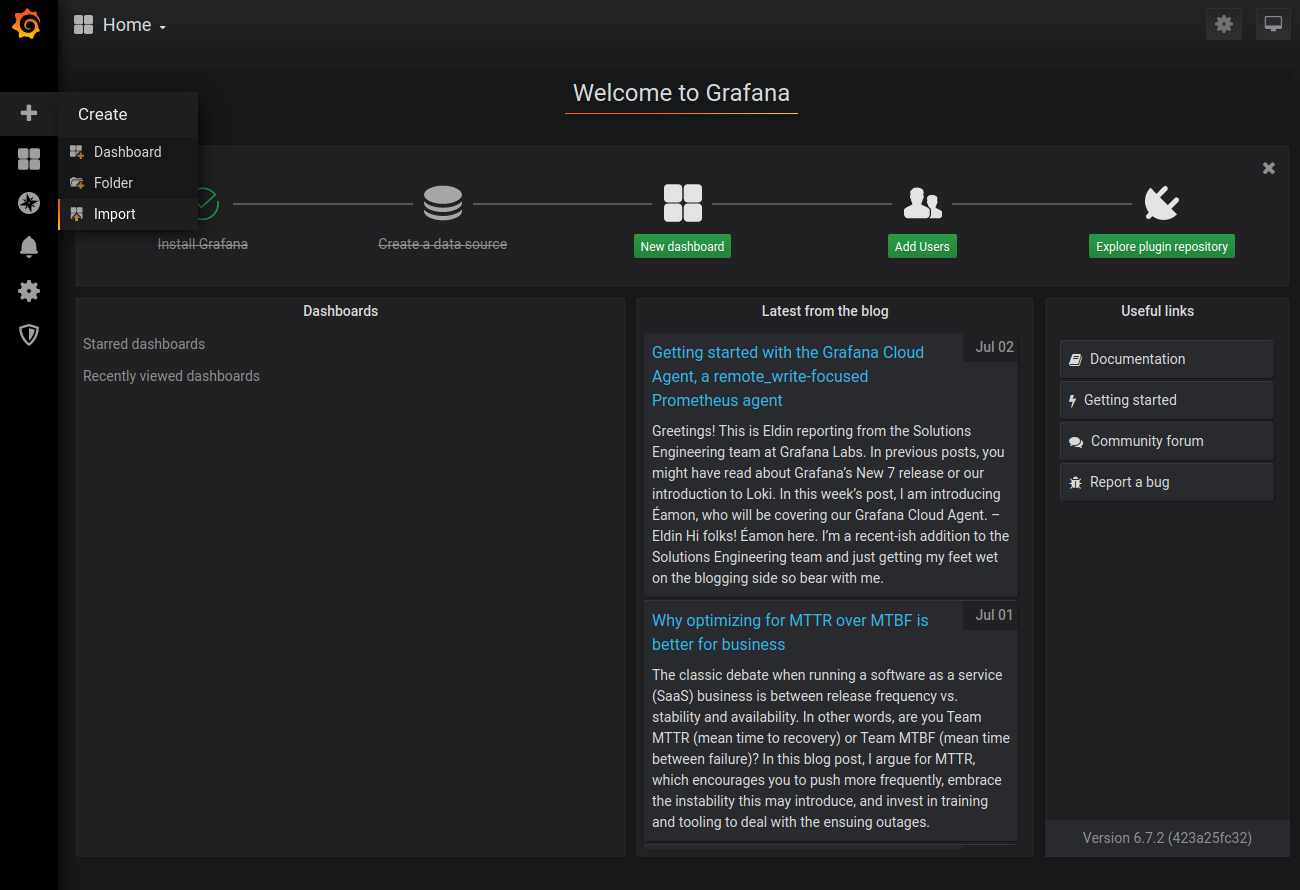
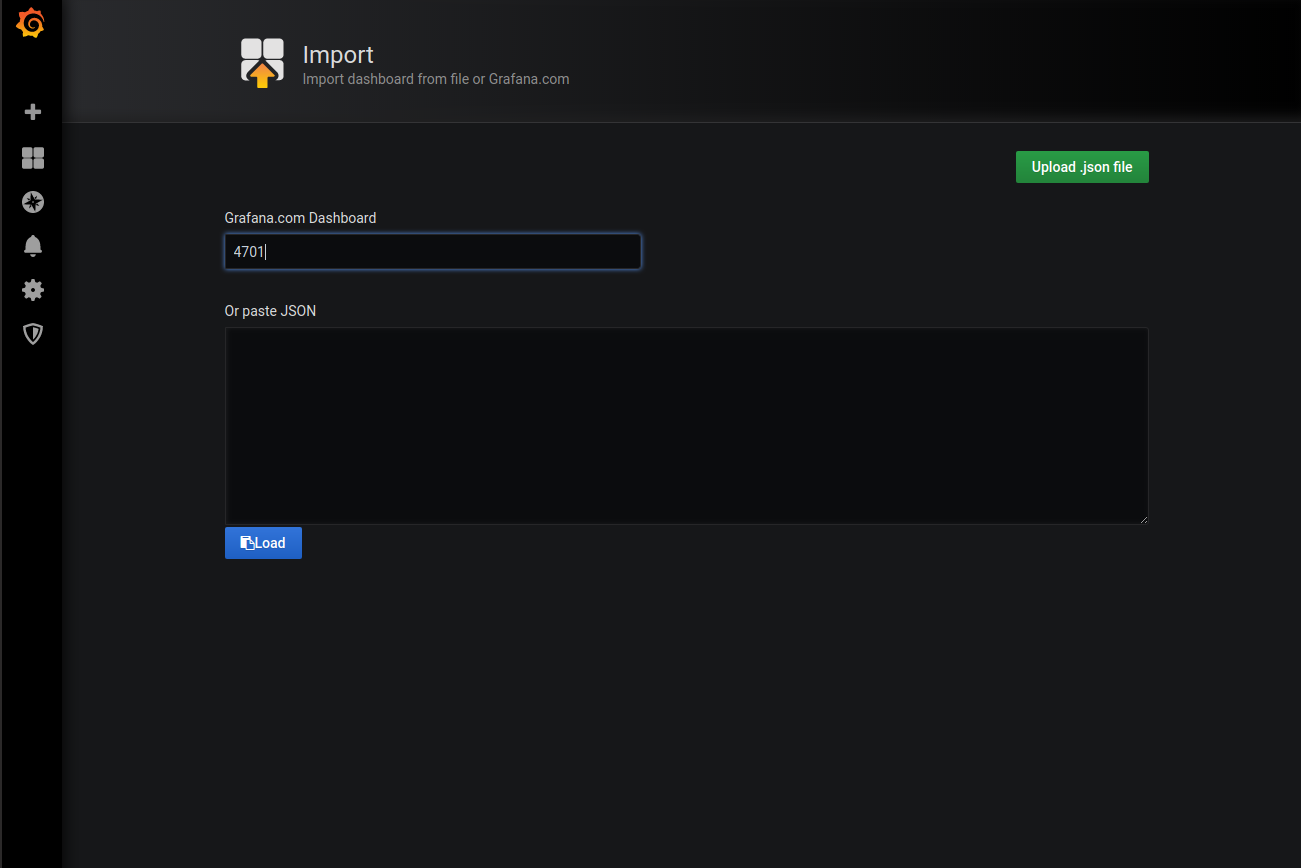
On the Import page we supply the pre-configured dashboard id # 4701.
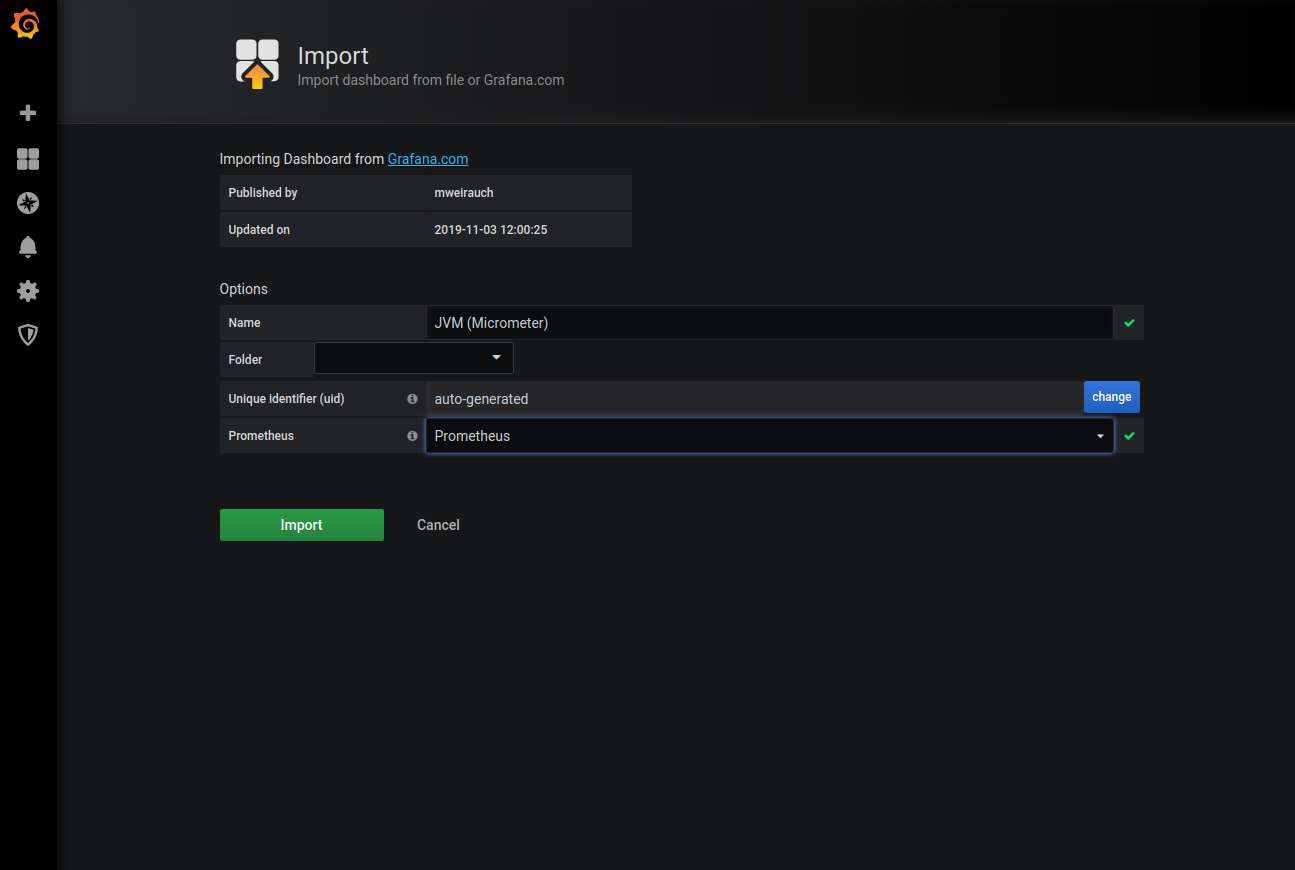
We should now see the details for JVM (Micrometer)Dashboard. We have set the Prometheus datasource to our Prometheus source.
If everything went correctly, you should see fairly comprehensive subset of the metrics the JVM is capturing. The Application drop-down (outline in yellow in the screencap) allows us to select which service JVM metrics to display. The Configuration-Service should already be selected since it is the only service available.
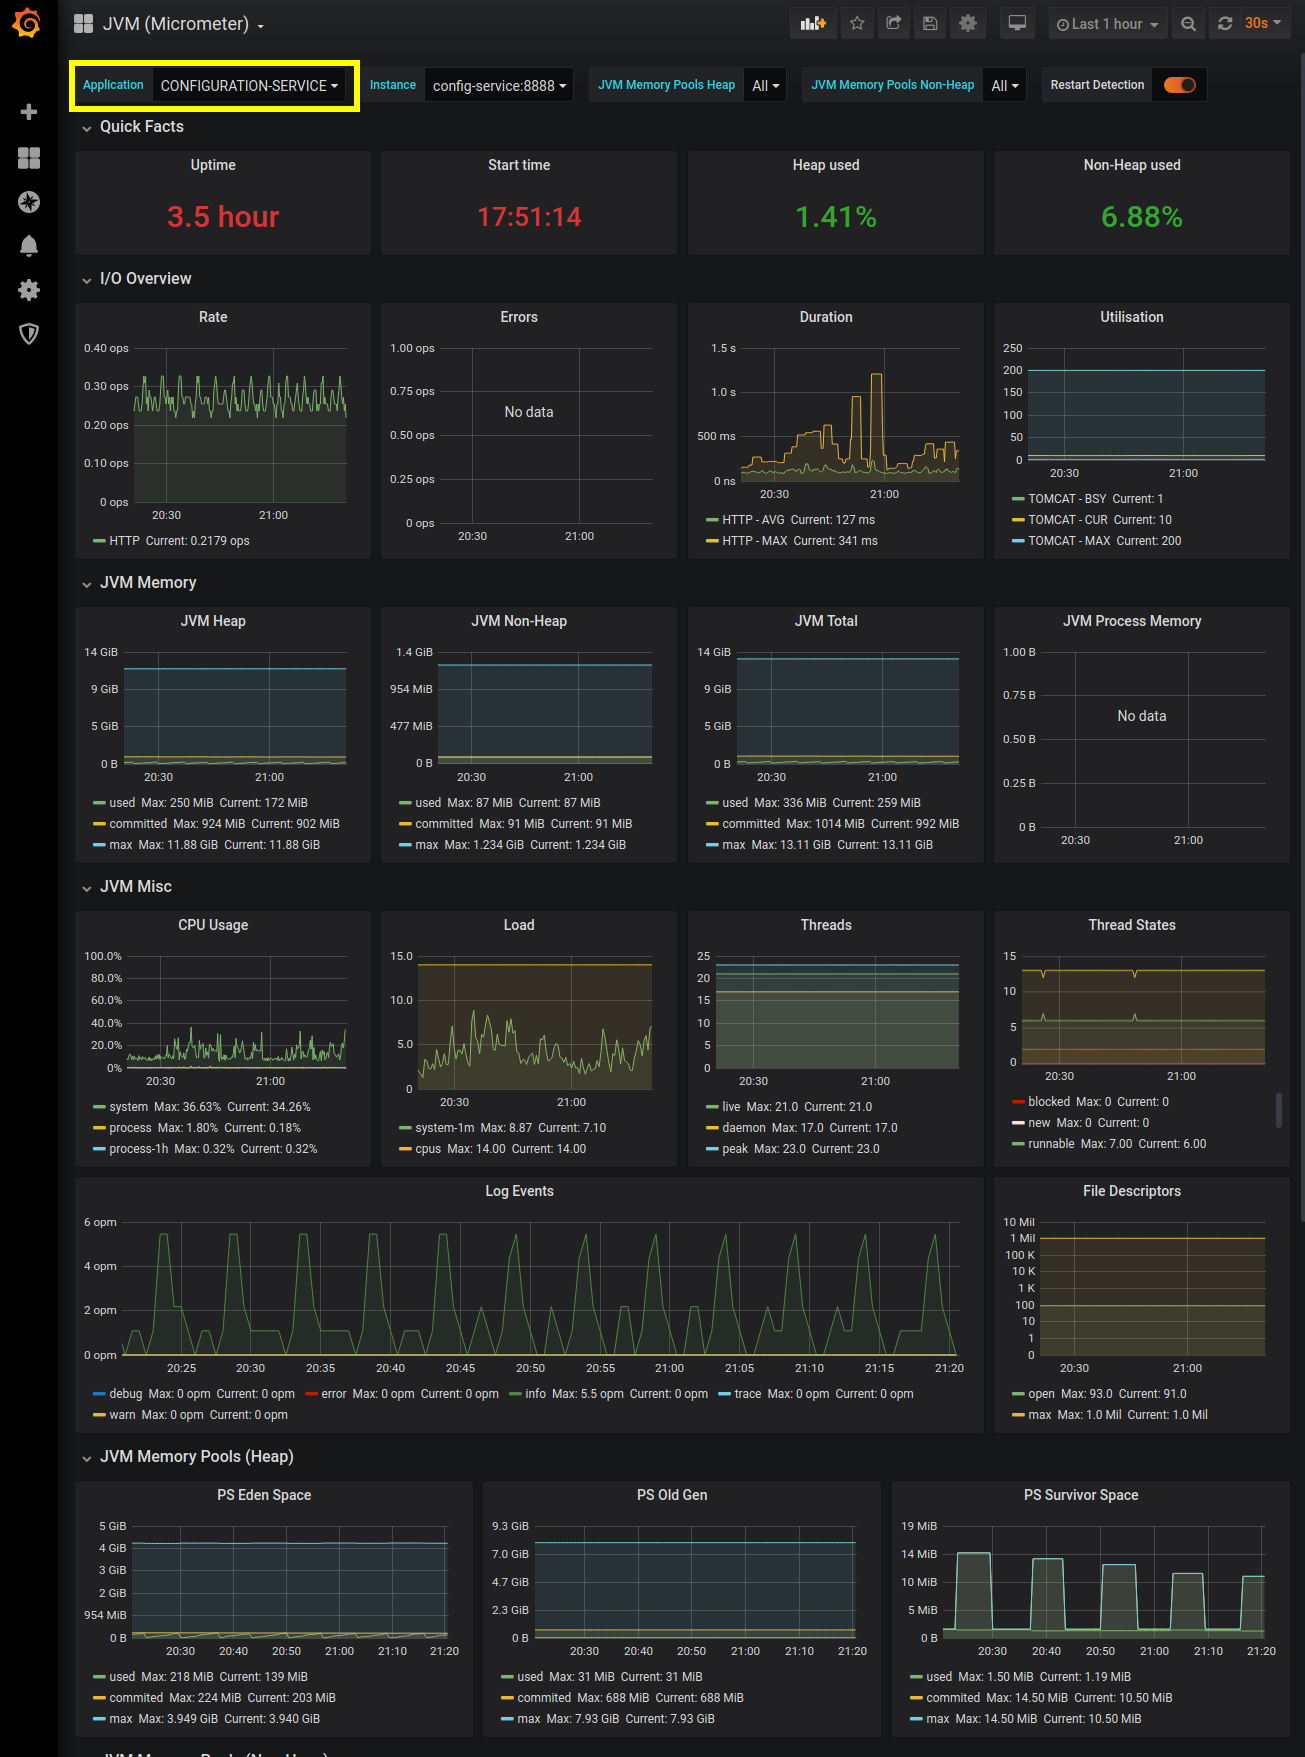
This screencap displays roughly half of the metrics that are displayed within this Grafana dashboard. We will be using this Dashboard for monitoring our services' JVM metrics, and a separate dashboard for our application service metrics. Grafana is extremely configurable, so feel free to modify the dashboards to suit your tastes. If you want to dig deeper into Grafana, check our their Getting Started page.
In addition to the JVM Dashboard, we will also import a custom dashboard to monitor our Spring Boot HTTP metrics. As with our JVM dashboard, we will use the HTTP dashboard across all our services. Rather than load this dashboard from the Grafana website, we will upload it as a file. From the Import page, we will select Upload .json file
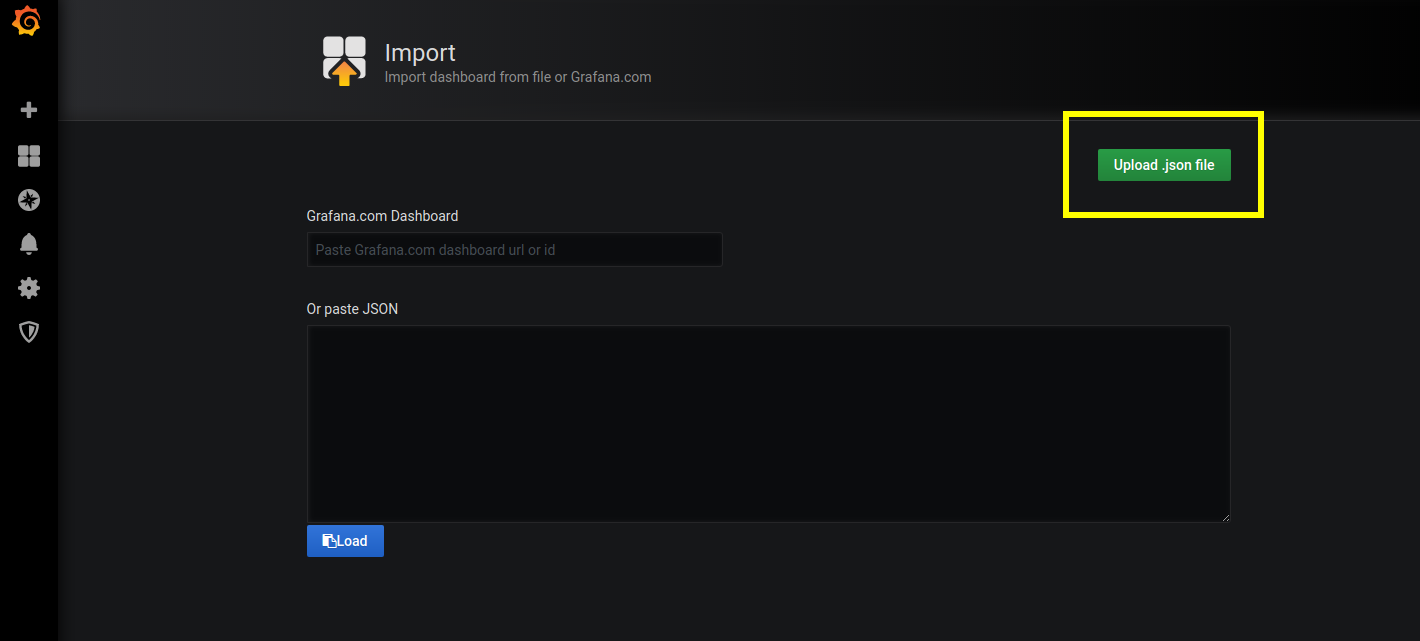
Select the HTTP-Dashboard.json file from your cloned ThinkMicroservices Github Dashboards repository.
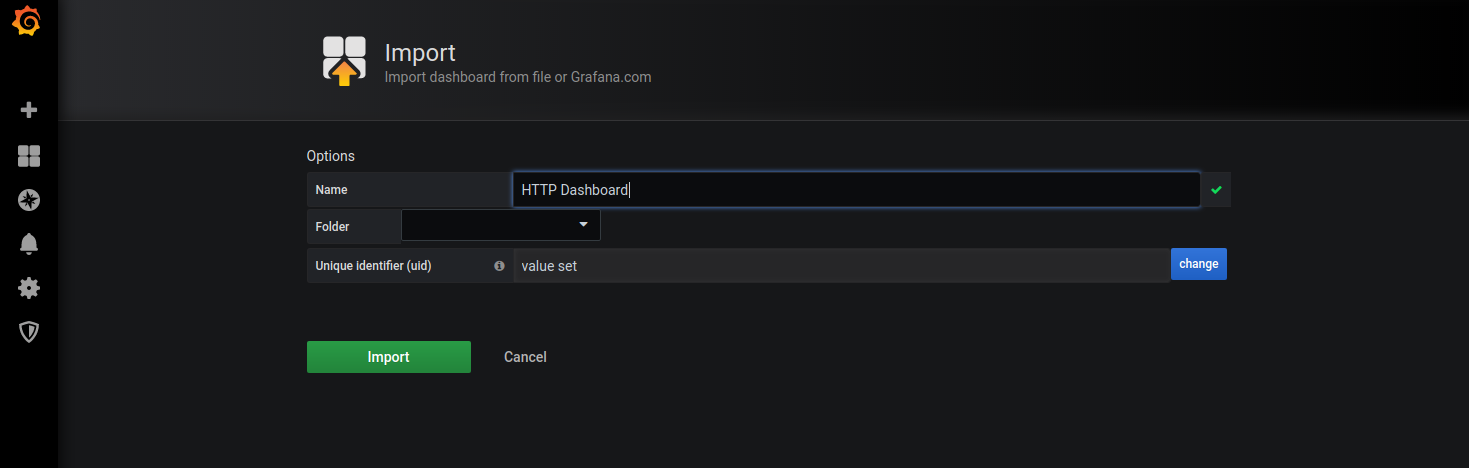
Then click the Import button.
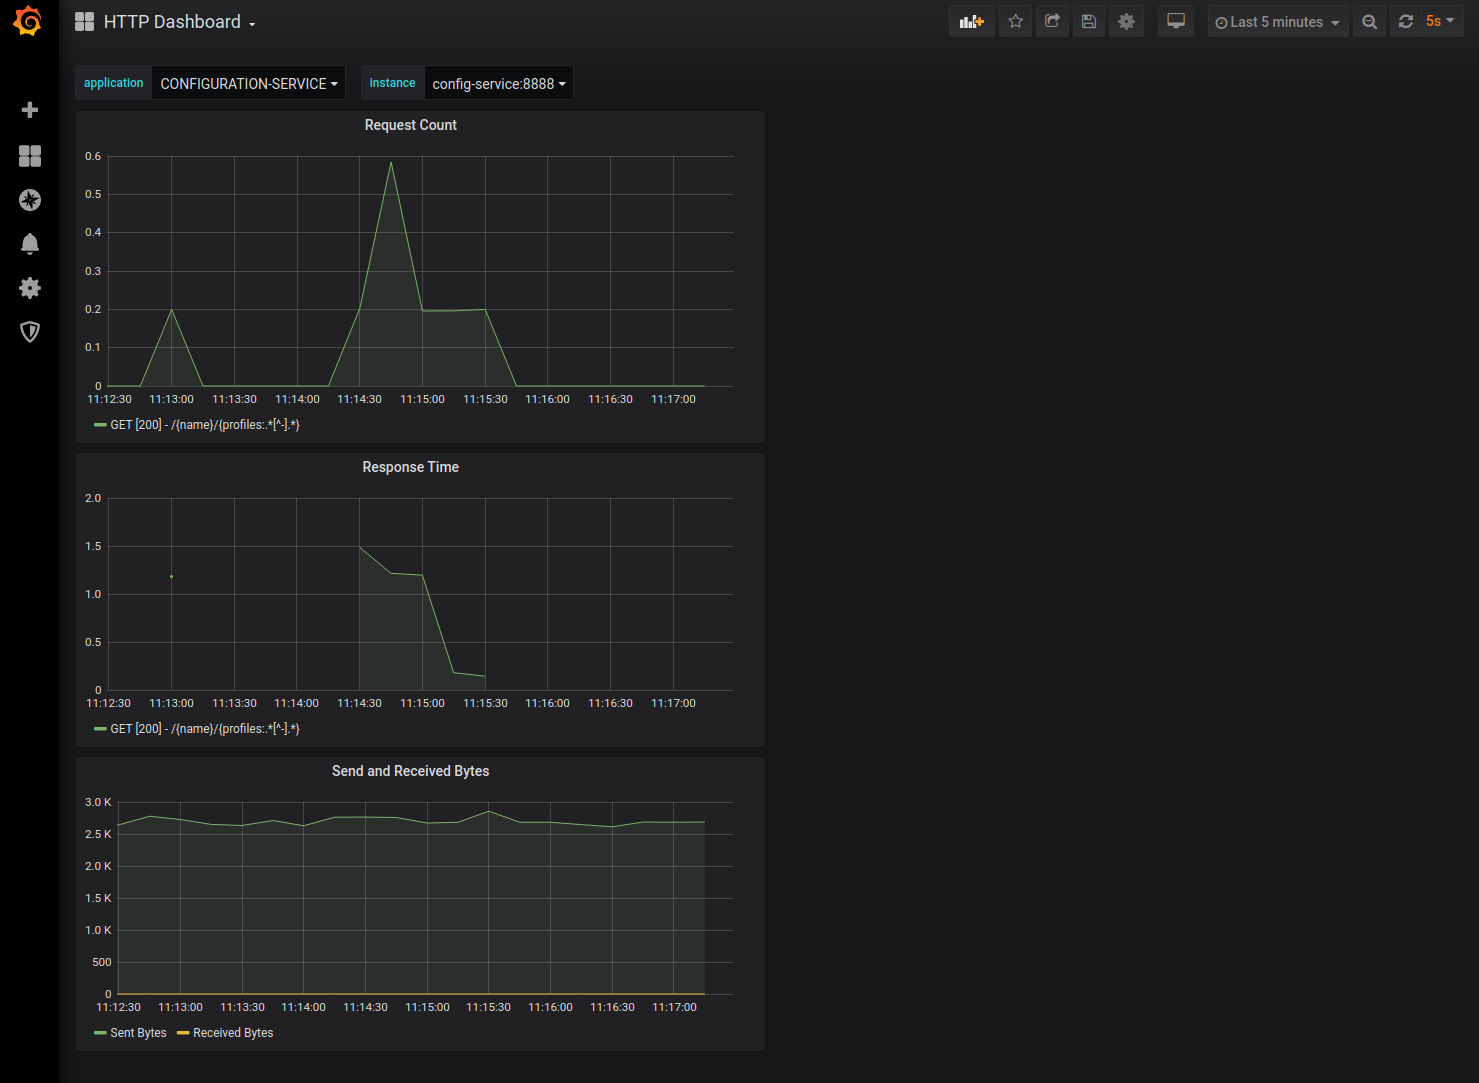
Here we see the HTTP Dashboard with the CONFIGURATION-SERVICE selected.
Congratulations! You now have the core of the reference implementation running. You can query Elasticsearch to see the Configuration Service's log event using Kibana and monitor and visualize your service metrics with Prometheus and Grafana.
Resources
- ConfigurationService Github repository.
- ConfigurationService docker hub image.
- Grafana JVM (Micrometer) Dashboard.

Twitter
Facebook
Reddit
LinkedIn
Email