Photo by Saeid Anvar from Pexels
Introduction
in this article, we will build the second service in our reference implementation application, The Discovery Service. As we discussed in the previous article on Service Discovery, we will implement a service provides a registry of available services. As services come on line they inform the Discovery Service that they are available. Services can also query the Discovery Service to find available services by name.Requirements
Before you get started, you will need the following:- Java
- Maven
- Docker
- Docker-Compose
Building The Discovery Service
We continue to ease into development with our second service. Once again the bulk of the heavy lifting is being handled by Spring. In this case, we are leveraging the spring-cloud-starter-netflix-eureka-server dependency which provides the vast majority of the code we will be using for our Discovery service. Let's take a look at the Discovery Service's project file.Maven POM.XML
loading...The key features with the pom.xml are the inclusion of:
- spring-cloud-starter-netflix-eureka-server- this dependency provides the core service discovery features as well as the Eureka UI.
- spring-boot-starter-parent- which brings in the base spring dependencies.
- spring-cloud-config-client- which brings in the base spring cloud config client dependency, which enables the service to contact the Configuration-Service to retrieve its application-specific configuration.
- spring-boot-starter-actuator- this dependency provides a number of monitoring and management features include a health check endpoint that will indicate the state of the service (UP|DOWN)
- logstash-logback-encode- which provides a logging appender that supports JSON log formatting.
- spring-boot-maven-plugin- which extends Maven with spring-boot specific goals (e.g., run, uber-jar).
- dockerfile-maven-plugin- which extends Maven with the ability to process a Dockerfile to create a corresponding Docker Image.
The Source
Here again, we see that we are writing very little code to realize our Discovery Service.loading...We simply create a Spring Boot application class and add the @EnableEurekaServer annotation. Everything else we will be doing through configuration.
Service Configuration
The Discovery Service (like most of application services) is configured through two configuration files, bootstrap.yml and application.yml.bootstrap.yml
loading...The bootstrap.yml configuration file provides the application name ( DISCOVERY-SERVICE) and it declares the parameters needed to configure the Discovery-Service to retrieve its remote configuration from the Configuration-Service.
application.yml
loading...Here the Discovery-Service listens on port 8761 and configure the local Eureka client to skip registering with the Discovery Service.
Discovery-Service Docker File
The following Dockerfile creates our DiscoveryService container image.loading...Here we can see the Dockerfile is almost identical to the ConfigurationService's Dockerfile. The primary difference is the exposed port ( 8761) and the application entrypoint ( com.thinkmicroservices.ri.spring.discovery.DiscoveryServiceApplication).
Docker-Compose
To add the Discovery-Service to the application, we will extend our previous Docker-Compose file by adding our Discovery Service.loading...Here we leverage the existing Elasticsearch , Fluentd, Kibana, and ConfigurationService instances from the previous article and add the DiscoveryService. It is important to understand that Docker-Compose does not have a mechanism for a service to wait for a dependent service to become available before starting. There are various ways around this. Here we choose to leverage a technique which checks the service's health using a container service. We add a new service named config-started which will poll the Configuration-Services's health status and only start the application when the service is available.
Discovery Service Web-Interface
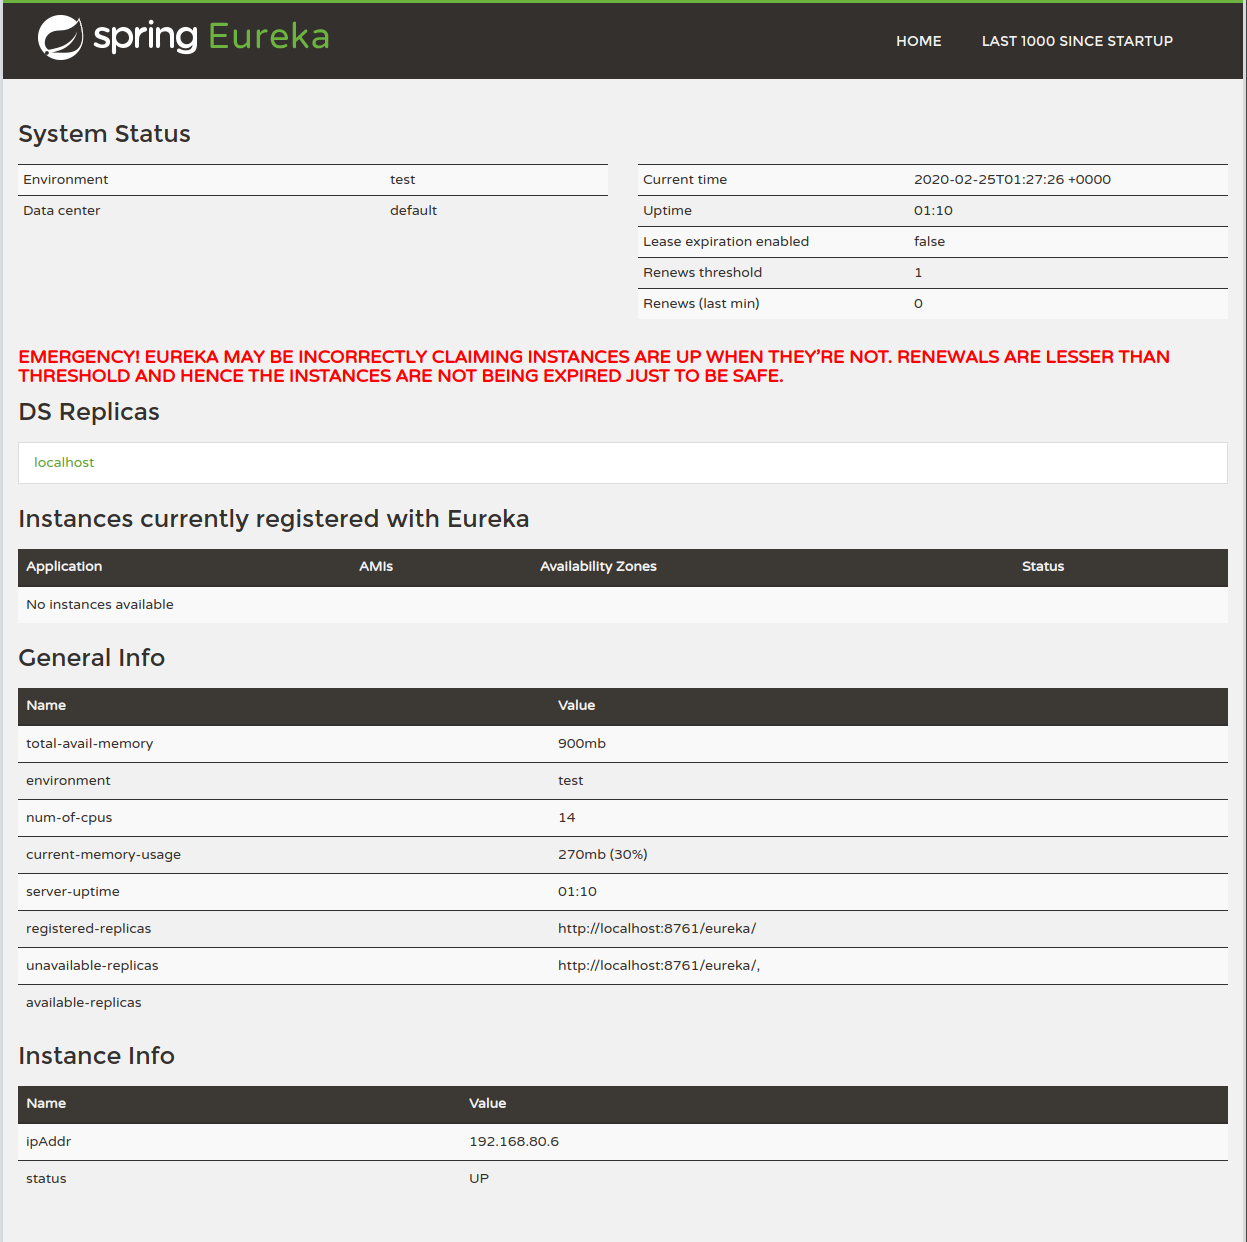
Once again, through the magic of the @EnableEurekaServer annotation, our Discovery-Service generates a web interface. To view the Discovery-Service web interface, copy the Docker-Compose file above to your local machine, and run it from the command prompt:docker-compose -f ./dc-01-discovery.yml up -d
Once all the services have started, point a web-browser to http://localhost:8761
If all the services have started, you should be seeing something similar to this.

The web interface displays the Discovery-Server's System status, Instances currently registered with Eureka (No services will be present as they haven't been built yet), General Information about the Discovery-Server's environment and Instance
Metrics and Monitoring
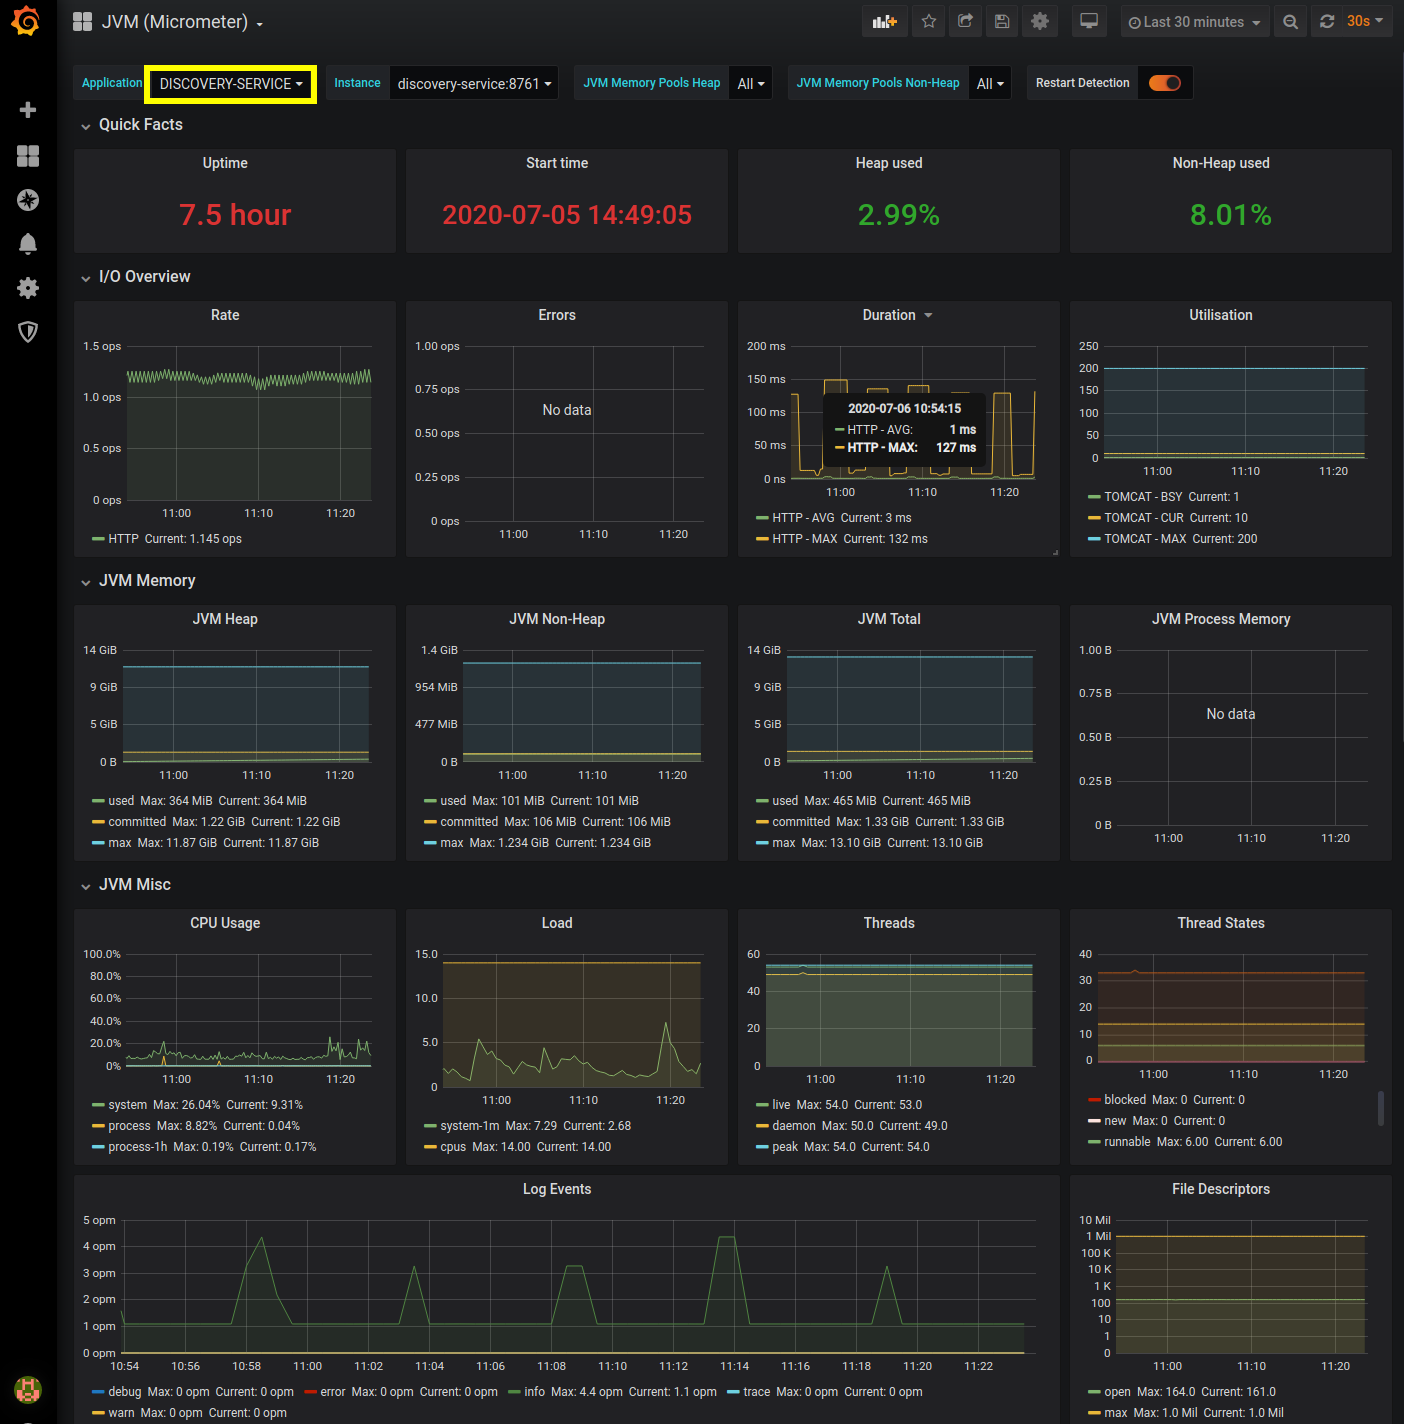
We will be not be monitoring any service-specific metrics in the Discovery-Service, but we will be monitoring its JVM. To enable this, we will need to update our prometheus.yml configuration file to include the following scrape_configs: entry.#####################
# discovery service #
#####################
- job_name: "discovery-service"
metrics_path: "/actuator/prometheus"
basic_auth:
username: 'think'
password: 'microservices'
scrape_interval: 5s
static_configs:
- targets: ['discovery-service:8761']

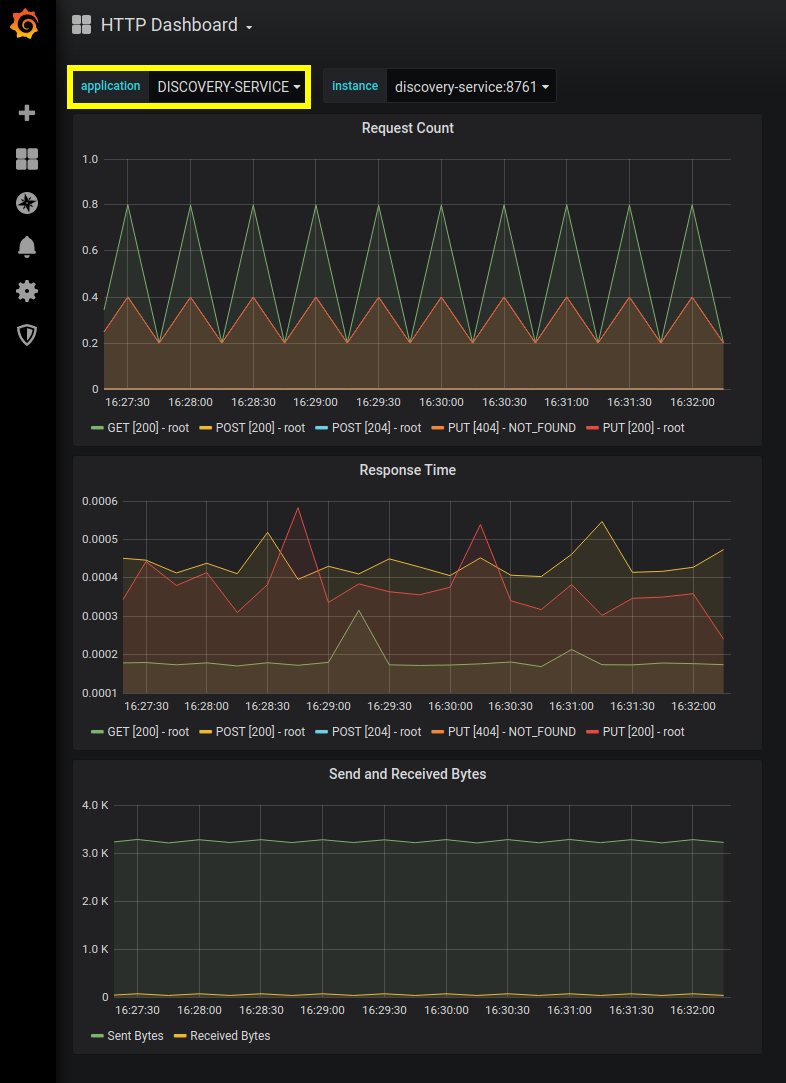
Switching over to the HTTP Dashboard, we can select DISCOVERY-SERVICE and view its data.

We now have an application composed of a Configuration Service, Discovery service, Elasticsearch, Kibana, Prometheus and Grafana.
Resources
- DiscoveryService GitHub repository
- DiscoveryService docker hub image.
- Grafana JVM (Micrometer) Dashboard.


Twitter
Facebook
Reddit
LinkedIn
Email