

Photo by Ricardo Gomez Angel on Unsplash
What is a Service Mesh
Up to this point, each of our application's services was responsible for handling its request delivery, transport-layer security, retry management, and circuit breaker configuration. While this is certainly a valid approach, it adds an additional burden on the service development team to manage these responsibilities. To mitigate this burden, we can introduce a Service Mesh into our application's architecture.A Service Mesh is a configurable infrastructure layer that acts as an intermediary between the application's services. A Service Mesh decouples connection security, reliability, and observability responsibilities from our application code to external infrastructure to provide uniform networking capabilities across the application. The Service Mesh layer is configured to handle client-side retries, service load balancing, mutual Transport Layer Security (mTLS), connection timeout configuration, and inter-service metric collection.
To accomplish this, most Service Meshes deploy a proxy instance (often referred to as a sidecar) adjacent to each service deployed. The sidecar proxy mediates all traffic into or out of its companion service.

The Service Mesh itself is composed of a mesh of sidecar proxies and is not itself part of the application services it supports. It is part of the deployment infrastructure. As an infrastructure component, the Service Mesh is fully decoupled from the application code.
Like Kubernetes, most Service Meshes are composed of two primary elements: a Data Plane and a Control Plane.
Data Plane
The Data Plane consists of the set of deployed sidecar proxies to mediate all inter-service traffic. Each sidecar extends the features of its companion service container to provide:- Health Check- Each service's sidecar proxy monitors its companion and communicates its availability to the Control Plane. This health check includes active monitoring of the services health status endpoint and passive monitoring of recent failures.
- Service Discovery- When a service connects to another service, it does so through the sidecar proxy. Each sidecar s responsible for determining the appropriate instance of the target service.
- Routing- For each outbound request, the sidecar will determine which available service will perform the request and creates the appropriate proxy connection. Routing includes performing any necessary Load Balancing across replicas and handling connection retry and circuit breaker functions.
- Mutual Transport Layer Security (mTLS)- Each sidecar enforces service to service security by verifying the caller's security credentials before providing access to the requested endpoint.
- Observability- while mediating requests between services, the sidecar can capture and log inter-service communication statistics and distributed tracing data to provide traffic flow information to assist in communication troubleshooting.
Control Plane
The Control Plane is a configuration server that controls all Service Mesh sidecars. The Control Plane is used to define inter-service security policies and configuration for the Data Plane, and aggregating the Data Plane's metrics.Service Mesh Landscape
There are many open-source Service Mesh options from which to choose. These include Istio, developed by Google & IBM, Consul Connect, from HashiCorp, Linkerd, from the Cloud Native Computing Foundation (CNCF) to name a few. In this article, we will be employing the Linkerd service mesh. We chose Linkerd for two reasons: it is extremely easy to install within the MicroK8S cluster we will be using, and it prois the default Service Mesh in the PLONK stack, which we will be exploring in a future article.
Linkerd is a Cloud Native Computing Foundation open-source service mesh that, according to its website is, ultra-light, ultra-simple, and ultra-powerful". It adds security, observability, and reliability to the Kubernetes platform without the complexity. We can define each of these attributes as follows:
- Security-Transparent mTLS, security certificate management, and rotation, custom security policies.
- Observability- Capture and display of service-level metrics. Specifically the golden metrics: success rates, latencies, and throughput. Additionally, the service mesh can illustrate the currently configured service topologies.
- Reliability- The service mesh can configure and manage connection retries, timeouts, load-balancing, and circuit-breakers.
Kubernetes and Linkerd
While Linkerd doesn't require Kubernetes, it does integrate easily with it. In this article, we will be using Linkerd with Microk8s. Microk8s provides a small footprint instance of Kubernetes. Out of the box, it provisions only the minimum complement of services required by Kubernetes (api-server, controller-manager, scheduler, kubelet, cni, kube-proxy). However, it does support the notion of Add-ons, which provide pre-configured Kubernetes services that work without additional setup or configuration. With Microk8s, Linkerd is enabled via the Microk8s CLI using the following command:microk8s enable linkerdOnce enabled, we can verify the installation with the following command:
microk8s linkerd checkIf the Linkerd add on is installed correctly, the output should appear similar to the following:
kubernetes-api
--------------
√ can initialize the client
√ can query the Kubernetes API

kubernetes-version
------------------
√ is running the minimum Kubernetes API version
√ is running the minimum kubectl version

linkerd-existence
-----------------
√ 'linkerd-config' config map exists
√ heartbeat ServiceAccount exist
√ control plane replica sets are ready
√ no unschedulable pods
√ controller pod is running
√ can initialize the client
√ can query the control plane API

linkerd-config
--------------
√ control plane Namespace exists
√ control plane ClusterRoles exist
√ control plane ClusterRoleBindings exist
√ control plane ServiceAccounts exist
√ control plane CustomResourceDefinitions exist
√ control plane MutatingWebhookConfigurations exist
√ control plane ValidatingWebhookConfigurations exist
√ control plane PodSecurityPolicies exist

linkerd-identity
----------------
√ certificate config is valid
√ trust anchors are using supported crypto algorithm
√ trust anchors are within their validity period
√ trust anchors are valid for at least 60 days
√ issuer cert is using supported crypto algorithm
√ issuer cert is within its validity period
√ issuer cert is valid for at least 60 days
√ issuer cert is issued by the trust anchor

linkerd-webhooks-and-apisvc-tls
-------------------------------
√ tap API server has valid cert
√ tap API server cert is valid for at least 60 days
√ proxy-injector webhook has valid cert
√ proxy-injector cert is valid for at least 60 days
√ sp-validator webhook has valid cert
√ sp-validator cert is valid for at least 60 days

linkerd-api
-----------
√ control plane pods are ready
√ control plane self-check
√ [kubernetes] control plane can talk to Kubernetes
√ [prometheus] control plane can talk to Prometheus
√ tap api service is running

linkerd-version
---------------
√ can determine the latest version
√ cli is up-to-date


control-plane-version
---------------------

√ control plane and cli versions match


linkerd-prometheus
------------------
√ prometheus add-on service account exists
√ prometheus add-on config map exists
√ prometheus pod is running

linkerd-grafana
---------------
√ grafana add-on service account exists
√ grafana add-on config map exists
√ grafana pod is running

Status check results are √
Linkerd Admin
Now that we have Linkerd running, we can view its administration page using the following command:microk8s linkerd dashboardThe output should resemble the following:
Linkerd dashboard available at:
http://localhost:50750
Grafana dashboard available at:
http://localhost:50750/grafana
Opening Linkerd dashboard in the default browser
After the command executes, your default browser should launch and display Linkerd's admininistration page.
Linkerd-viz
In addition to Linkerd's administration application, we will also be using Linkerd-viz. Linkerd-viz is an application that collects and displays Linkerd metrics via its own Grafana dashboard. We can install it using the following command:microk8s kubectl apply -f https://raw.githubusercontent.com/linkerd/linkerd-viz/master/k8s/linkerd-viz.yml
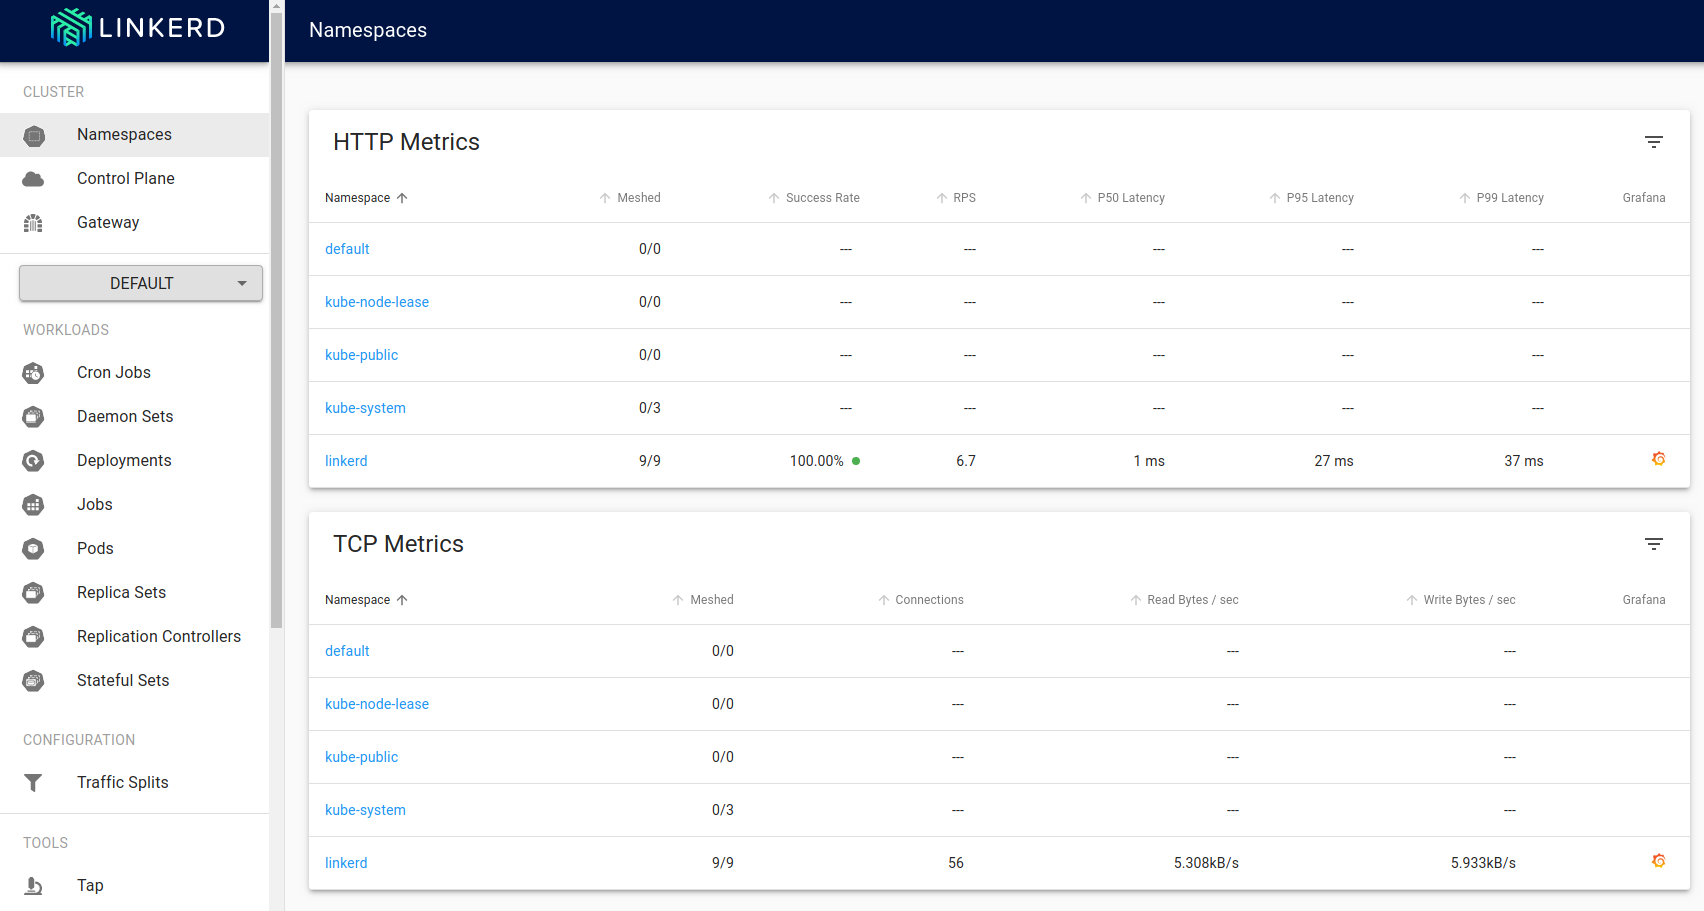
You can launch the Linkerd-Viz application from the Linkerd administration page. Locate the linkerd namespace row under HTTP Metrics.

Click on the linkerd element under the column titled Grafana (highlighted here in read) to view the Linkerd-Viz dashboard.
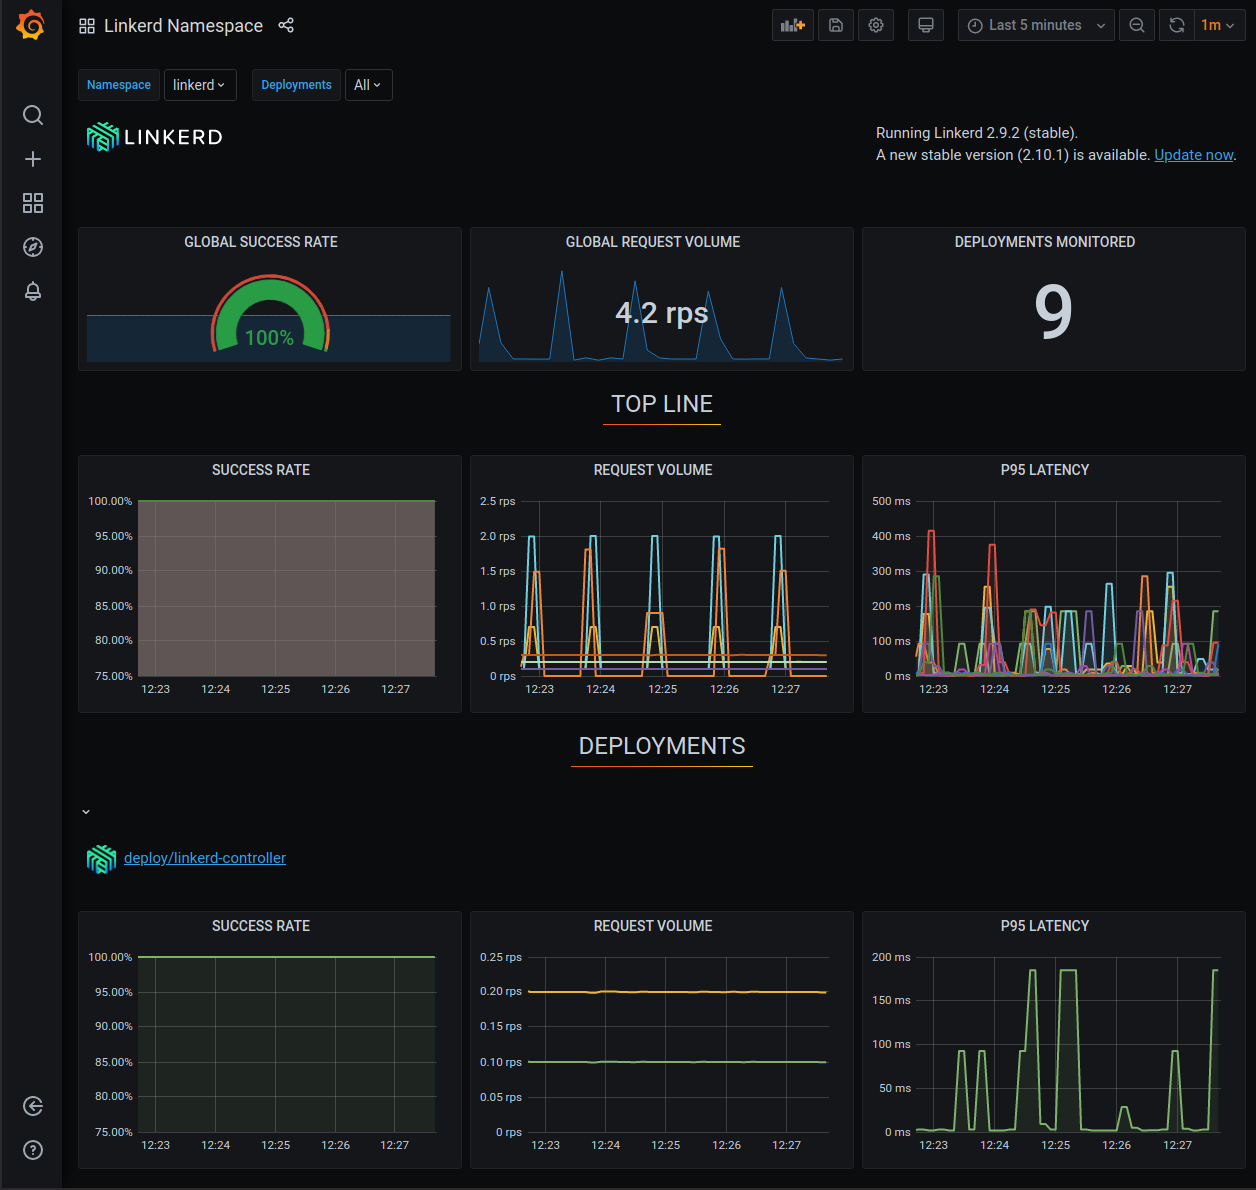
The Linkerd-Viz dashboard is arranged into three sections: Top Line, Service Metrics, and Per-Instance Metrics.
- Top Line- Displays the number of namespaces and deployments currently being monitored and the cluster-wide request volume and success rate.
- Service Metrics- Displays a row of request success rate, request volume (requests-per-second), and P95 latency for each monitored deployment. P95 latency indicates that 95% of the request traffic is experiencing latencies of this value or less.
- Per-Instance Metrics- Displays metrics for each node in the cluster.
Using Linkerd
Now that we have a working instance of Linkerd, the administration tool, and the dashboard running on our cluster, we will configure a simple example application to use the service mesh to encrypt traffic between two services and view the operational metrics.Using TLS to encrypt traffic
When configuring pods to use a Linkerd service mesh, HTTP communication is automatically upgraded to mutual Transport Layer Security (mTLS). This approach makes it easy to provide secure inter-service communications for every application. To demonstrate this, we will deploy a simple message service and an empty pod that we can kubectrl exec into to call the service from within the cluster.We will start by creating a namespace for our Linkerd test:
cat <<EOF | microk8s kubectl apply -f -
kind: Namespace
apiVersion: v1
metadata:
  name: linkerd-test
EOF
Now we create a deployment with our message service:
cat <<EOF | microk8s kubectl apply -f -
apiVersion: apps/v1
kind: Deployment
metadata:
  name: http-echo
  namespace: linkerd-test

spec:
  replicas: 1
  selector:
    matchLabels:
      run: http-echo
  template:
    metadata:
      labels:
        run: http-echo
    spec:
      containers:
      - name: http-echo
        image: hashicorp/http-echo
        ports:
        - containerPort: 80
        args:
        - -listen=:80
        - --text=Hello from http-echo
EOF
Now we will expose the deployment as a named service:
cat <<EOF | microk8s kubectl apply -f -
apiVersion: v1
kind: Service
metadata:
  name: http-echo
  namespace: linkerd-test
  labels:
    run: http-echo
spec:
  ports:
  - port: 80
    protocol: TCP
  selector:
    run: http-echo
EOF
Now we will deploy an instance of
Ubuntu that we can
exec into to call our service from:
cat <<EOF | microk8s kubectl apply -f -
apiVersion: v1
kind: Pod
metadata:
  name: ubuntu
  namespace: linkerd-test
  labels:
    app: ubuntu
spec:
  containers:
  - name: ubuntu
    image: ubuntu
    command:
      - "sleep"
      - "604800"
    imagePullPolicy: IfNotPresent

  restartPolicy: Always
EOF
With everything deployed, we e can
exec into the
Ubuntu instance with the following command:
microk8s kubectl --namespace linkerd-test exec ubuntu -it --container=ubuntu -- /bin/bashBefore we can call our message service, we will need to install the curl application.
apt-get update
apt-get install curl -y
We can now call our message service from our ubuntu shell:
curl http://http-echoThe output should look similar to this:
root@ubuntu:/# curl http://http-echo
Hello from http-echo
root@ubuntu:/#
At this point, we have successfully deployed our application and verfied that the two services can communicate across the cluster.
Linkerd Dashboard
If we look at the current Namespaces page in our Linkerd dashboard, we can see that Linkerd has detected a new namespace and has added it to the list ( linkerd-test):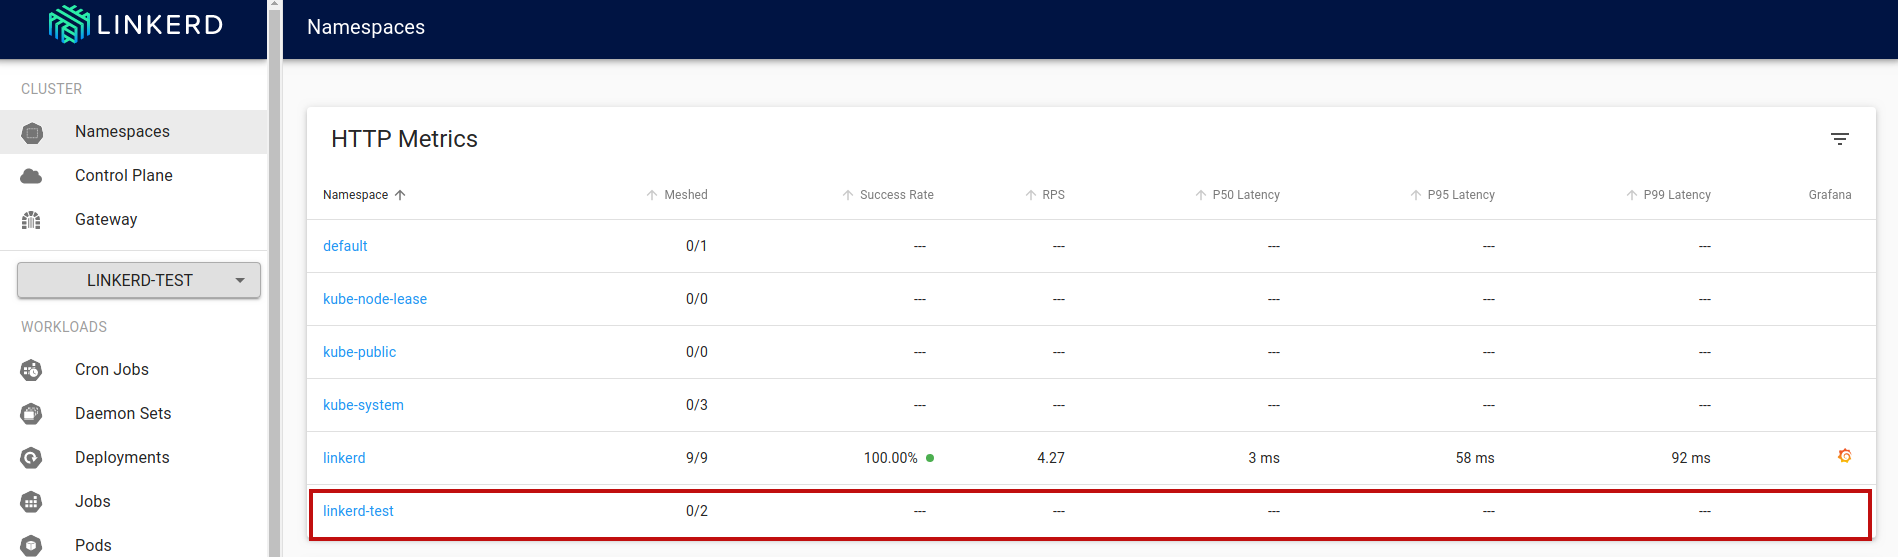
Clicking on the linkerd-test link will display the linkerd-test details page.
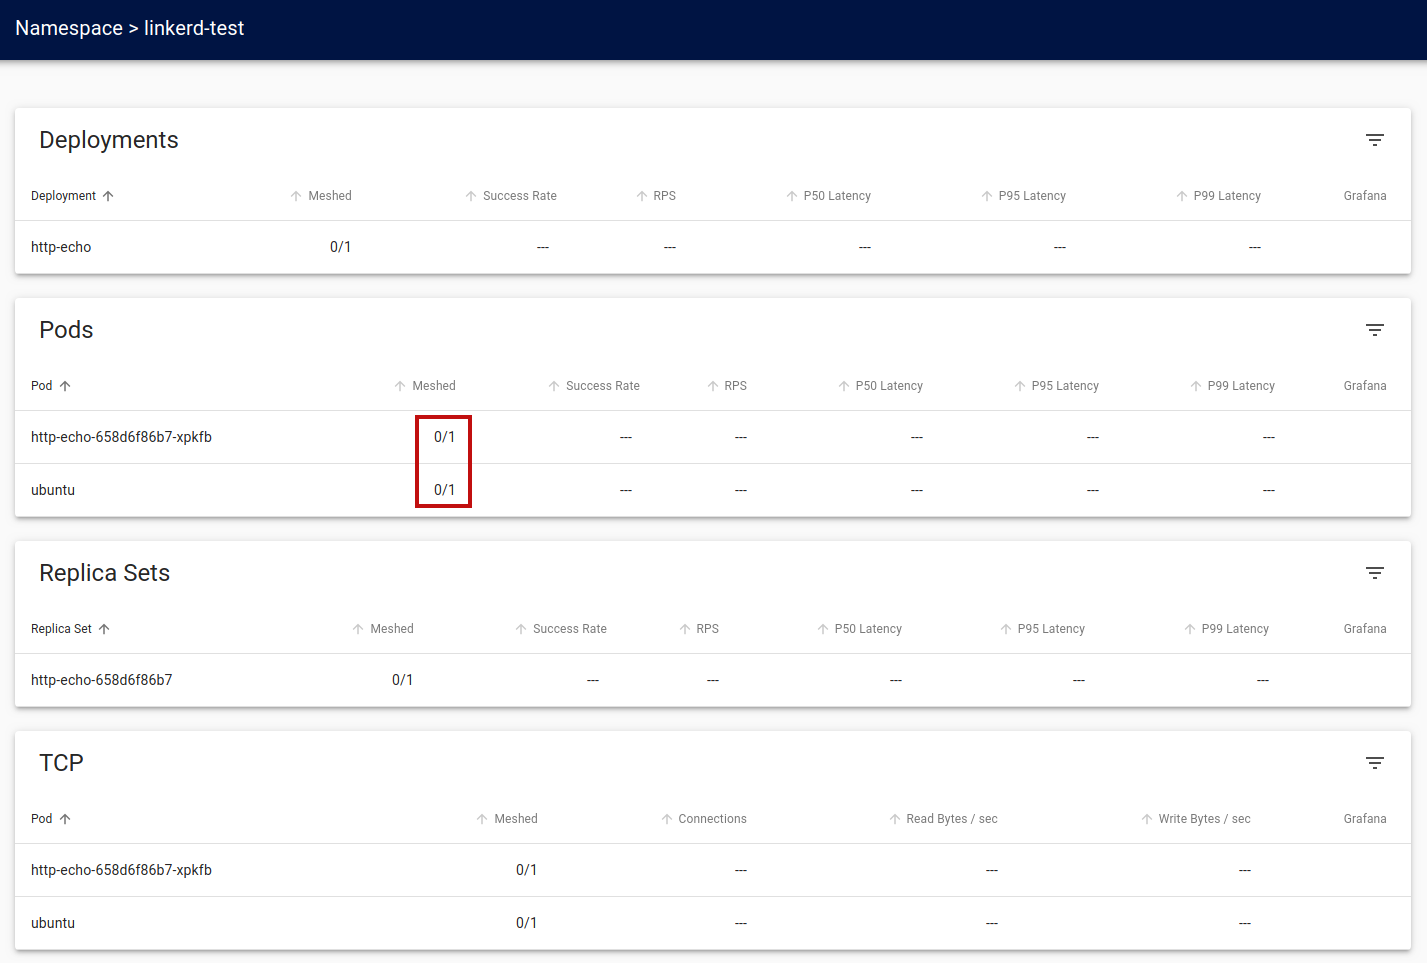
We can see that while the http-echo and ubuntu pods have deployed, they are currently unmeshed. While Linkerd can detect the new pods, it does not automatically mesh them. We must explicitly instruct Linkerd that we want the application to use the service mesh.
Meshing the application
To configure our application to use Linkerd, we must add the appropriate metadata annotations to instruct Kubernetes to use linkerd as our service mesh. The annotation we use is:
metadata:
  annotations:
    linkerd.io/inject: enabled
We could manually edit our application YAML files or use the
Linkerd
inject utility to handle this for us. The
inject command will parse the YAML file and inject the annotation in the appropriate location.
We will now rerun the commands with just the microk8s linkerd inject - command to see what has changed:
cat <<EOF |   microk8s linkerd inject -
apiVersion: apps/v1
kind: Deployment
metadata:
  name: http-echo
  namespace: linkerd-test

spec:
  replicas: 1
  selector:
    matchLabels:
      run: http-echo
  template:
    metadata:
      labels:
        run: http-echo
    spec:
      containers:
      - name: http-echo
        image: hashicorp/http-echo
        ports:
        - containerPort: 80
        args:
        - -listen=:80
        - --text=Hello from http-echo
EOF
the output is echoed to the console (but not applied to the cluster)
apiVersion: apps/v1
kind: Deployment
metadata:
  name: http-echo
  namespace: linkerd-test
spec:
  replicas: 1
  selector:
    matchLabels:
      run: http-echo
  template:
    metadata:
      annotations:
        linkerd.io/inject: enabled
      labels:
        run: http-echo
    spec:
      containers:
      - args:
        - -listen=:80
        - --text=Hello from http-echo
        image: hashicorp/http-echo
        name: http-echo
        ports:
        - containerPort: 80
cat <<EOF |   microk8s linkerd inject - | microk8s kubectl apply -f -
apiVersion: apps/v1
kind: Deployment
metadata:
  name: http-echo
  namespace: linkerd-test

spec:
  replicas: 1
  selector:
    matchLabels:
      run: http-echo
  template:
    metadata:
      labels:
        run: http-echo
    spec:
      containers:
      - name: http-echo
        image: hashicorp/http-echo
        ports:
        - containerPort: 80
        args:
        - -listen=:80
        - --text=Hello from http-echo
EOF
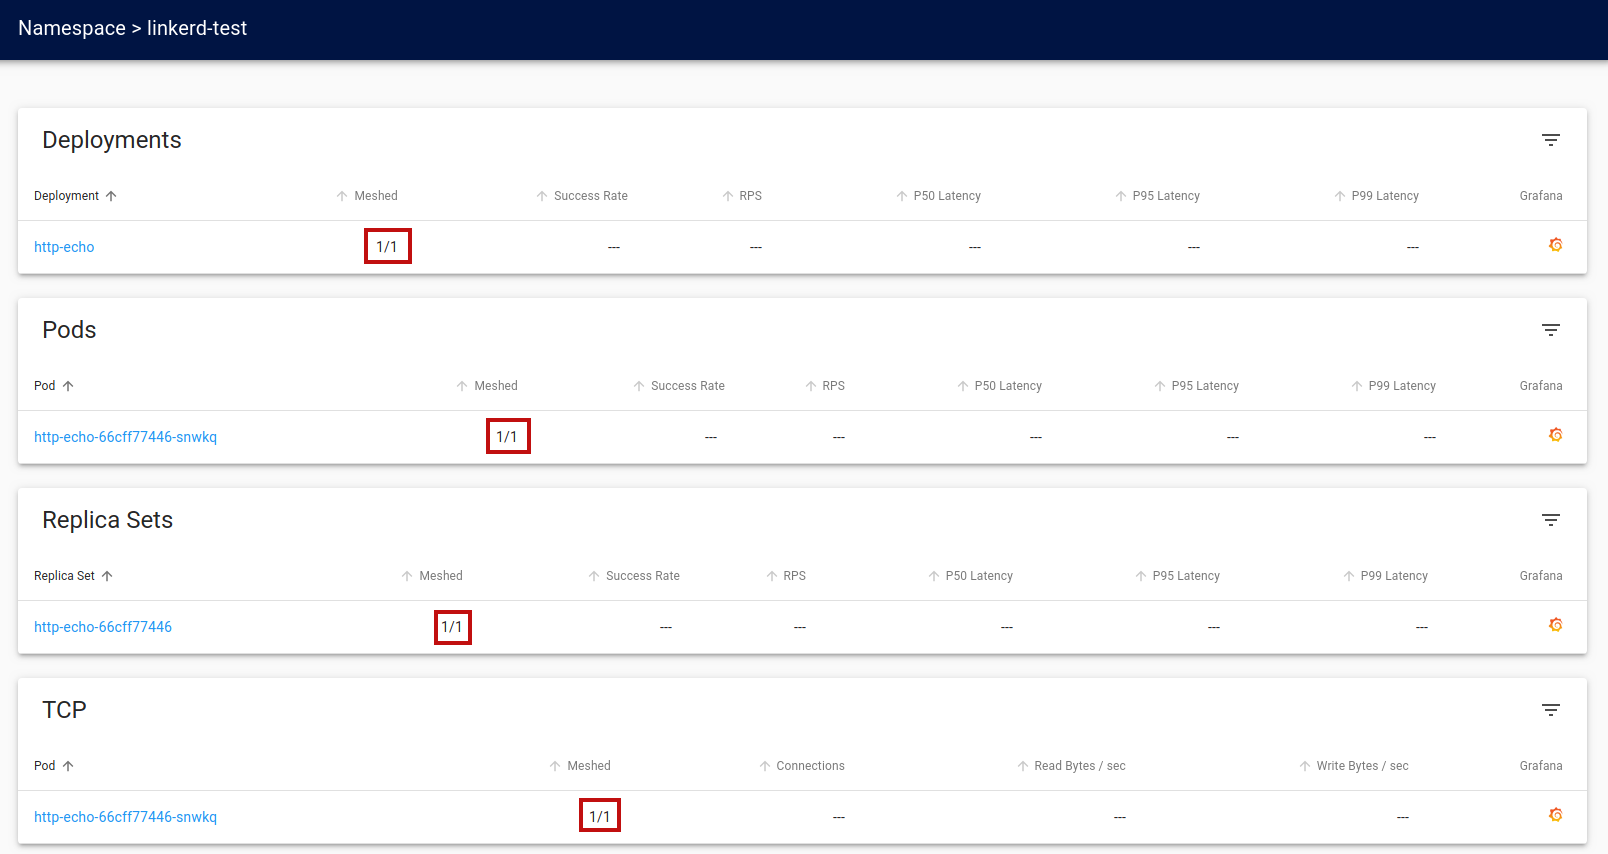
If we check the
Linkerd
details page, we see that our
deployment,
pod, and
replica set are now
meshed.
We now perform the same injection command on the service instance.
cat <<EOF | microk8s linkerd inject -
apiVersion: v1
kind: Service
metadata:
  name: http-echo
  namespace: linkerd-test
  labels:
    run: http-echo
spec:
  ports:
  - port: 80
    protocol: TCP
  selector:
    run: http-echo
EOF
The output of the
inject command is:
apiVersion: v1
kind: Service
metadata:
  name: http-echo
  namespace: linkerd-test
  labels:
    run: http-echo
spec:
  ports:
  - port: 80
    protocol: TCP
  selector:
    run: http-echo
cat <<EOF | microk8s linkerd inject - | microk8s kubectl apply -f -
apiVersion: v1
kind: Service
metadata:
  name: http-echo
  namespace: linkerd-test
  labels:
    run: http-echo
spec:
  ports:
  - port: 80
    protocol: TCP
  selector:
    run: http-echo
EOF
Lastly, we apply the
inject command to our
ubuntu instance.
cat <<EOF | microk8s linkerd inject -
apiVersion: v1
kind: Pod
metadata:
  name: ubuntu
  namespace: linkerd-test
  labels:
    app: ubuntu
spec:
  containers:
  - name: ubuntu
    image: ubuntu
    command:
      - "sleep"
      - "604800"
    imagePullPolicy: IfNotPresent

  restartPolicy: Always
EOF
The output of the
inject command is:
apiVersion: v1
kind: Pod
metadata:
  annotations:
    linkerd.io/inject: enabled
  labels:
    app: ubuntu
  name: ubuntu
  namespace: linkerd-test
spec:
  containers:
  - command:
    - sleep
    - "604800"
    image: ubuntu
    imagePullPolicy: IfNotPresent
    name: ubuntu
  restartPolicy: Always
cat <<EOF | microk8s linkerd inject - | microk8s kubectl apply -f -
apiVersion: v1
kind: Pod
metadata:
  name: ubuntu
  namespace: linkerd-test
  labels:
    app: ubuntu
spec:
  containers:
  - name: ubuntu
    image: ubuntu
    command:
      - "sleep"
      - "604800"
    imagePullPolicy: IfNotPresent

  restartPolicy: Always
EOF
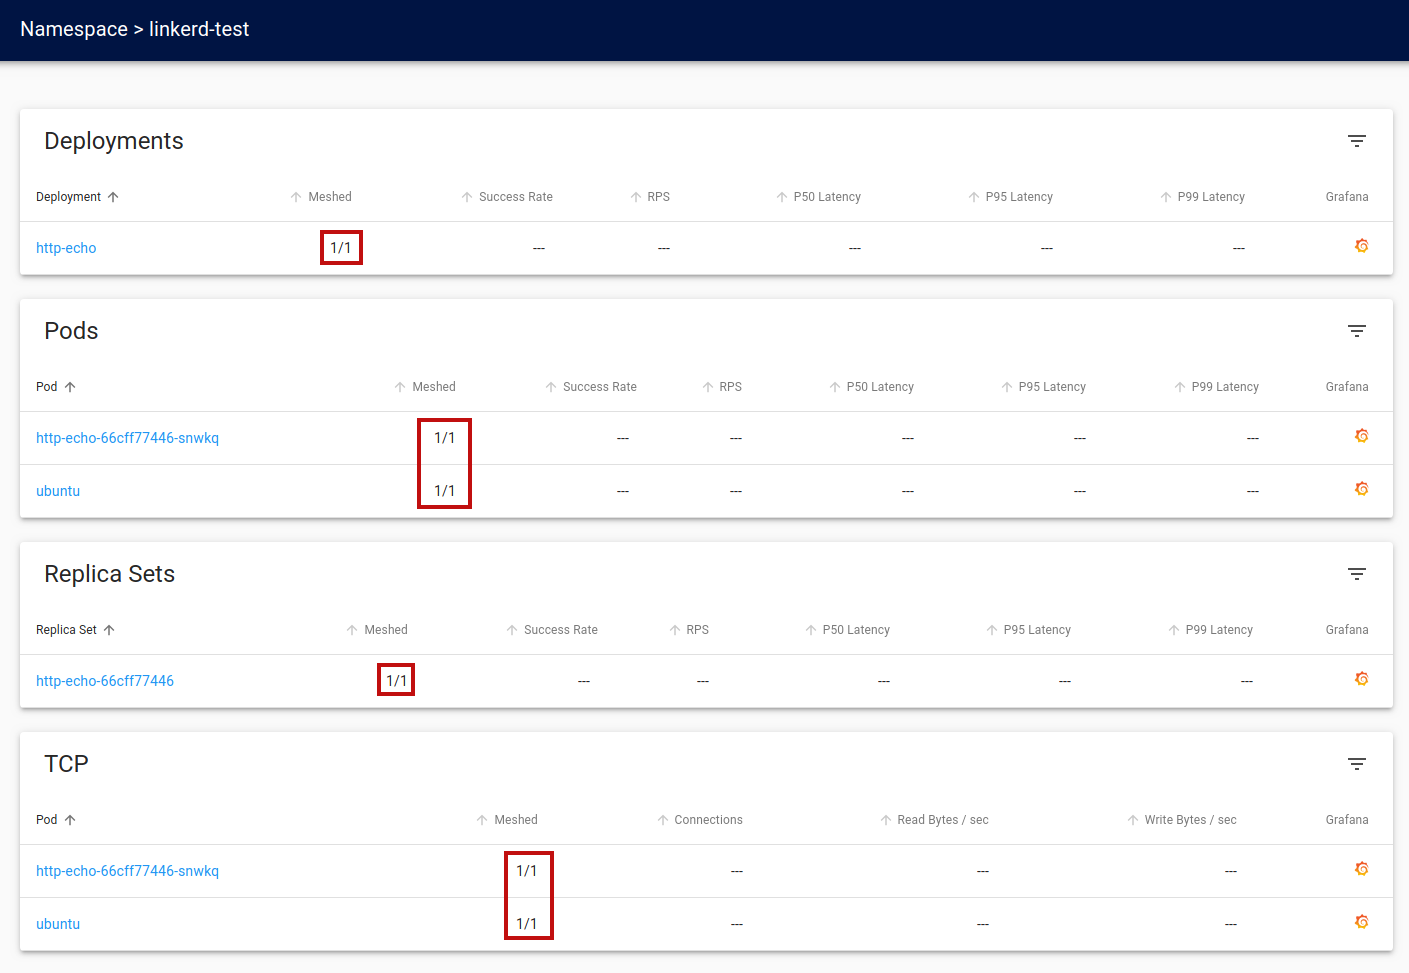
Now if we look at our
linkerd-test namespace detail page, we will see that the application is fully meshed.
Call the Http-Echo service
Once again, we will call the http-echo service from the ubuntu pod. However, this time, the two pods will be meshed together. Invoke the following command:microk8s kubectl --namespace linkerd-test exec ubuntu -it --container=ubuntu -- /bin/bashCall the message service using curl 10-15 times from the ubuntu shell:
curl http://http-echoThe calls will be routed by the service mesh and metrics will be captured.
Observability
As mentioned earlier, the ability to view the state of the service mesh and operational metrics is an impessential feature of a service mesh. With Linkerd, we have two views: the Linkerd service mesh details and the Grafana service metrics dashboard.Linkerd Details
In the Linkerd dashboard, we can drill down into each of the deployed pods to view its details by clicking the corresponding pod name.ubuntu pod
Here we see the Linkerd view of the ubuntu pod.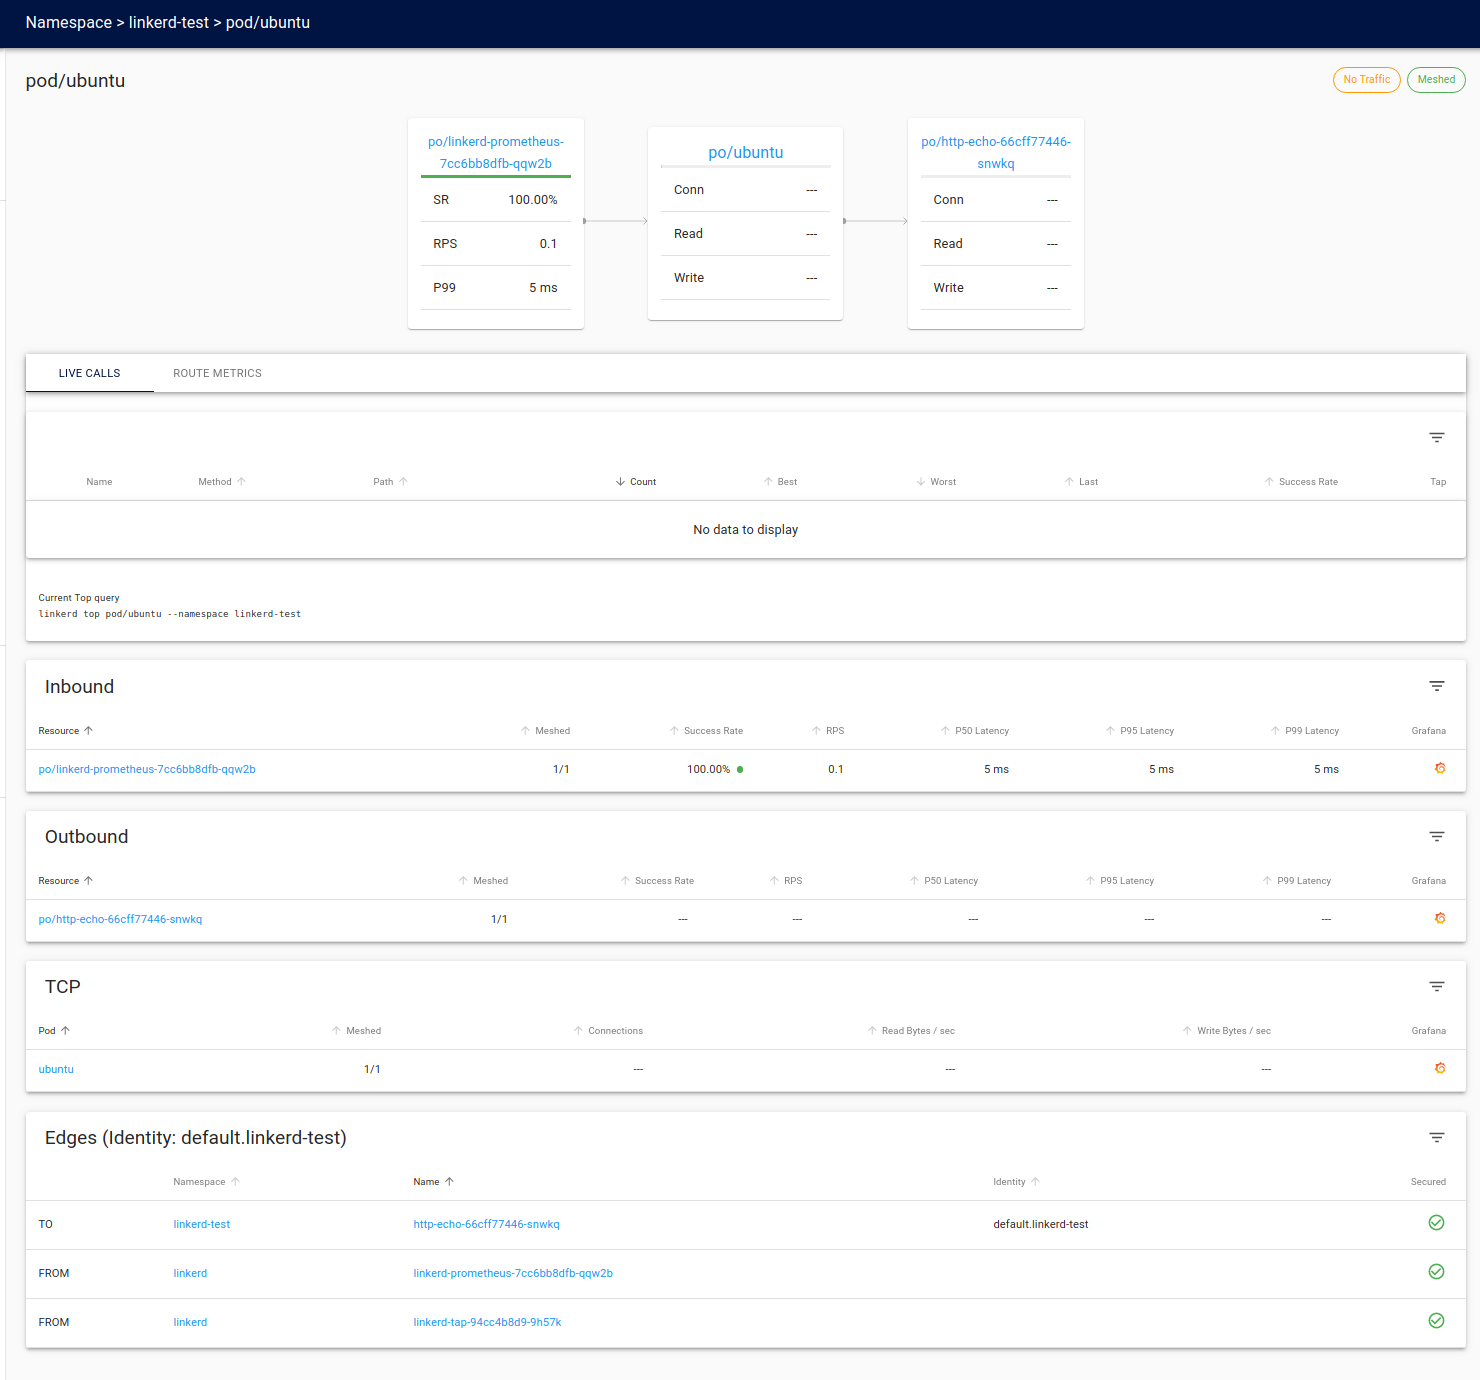
http-echo pod
Here we see the Linkerd view of the http-echo pod.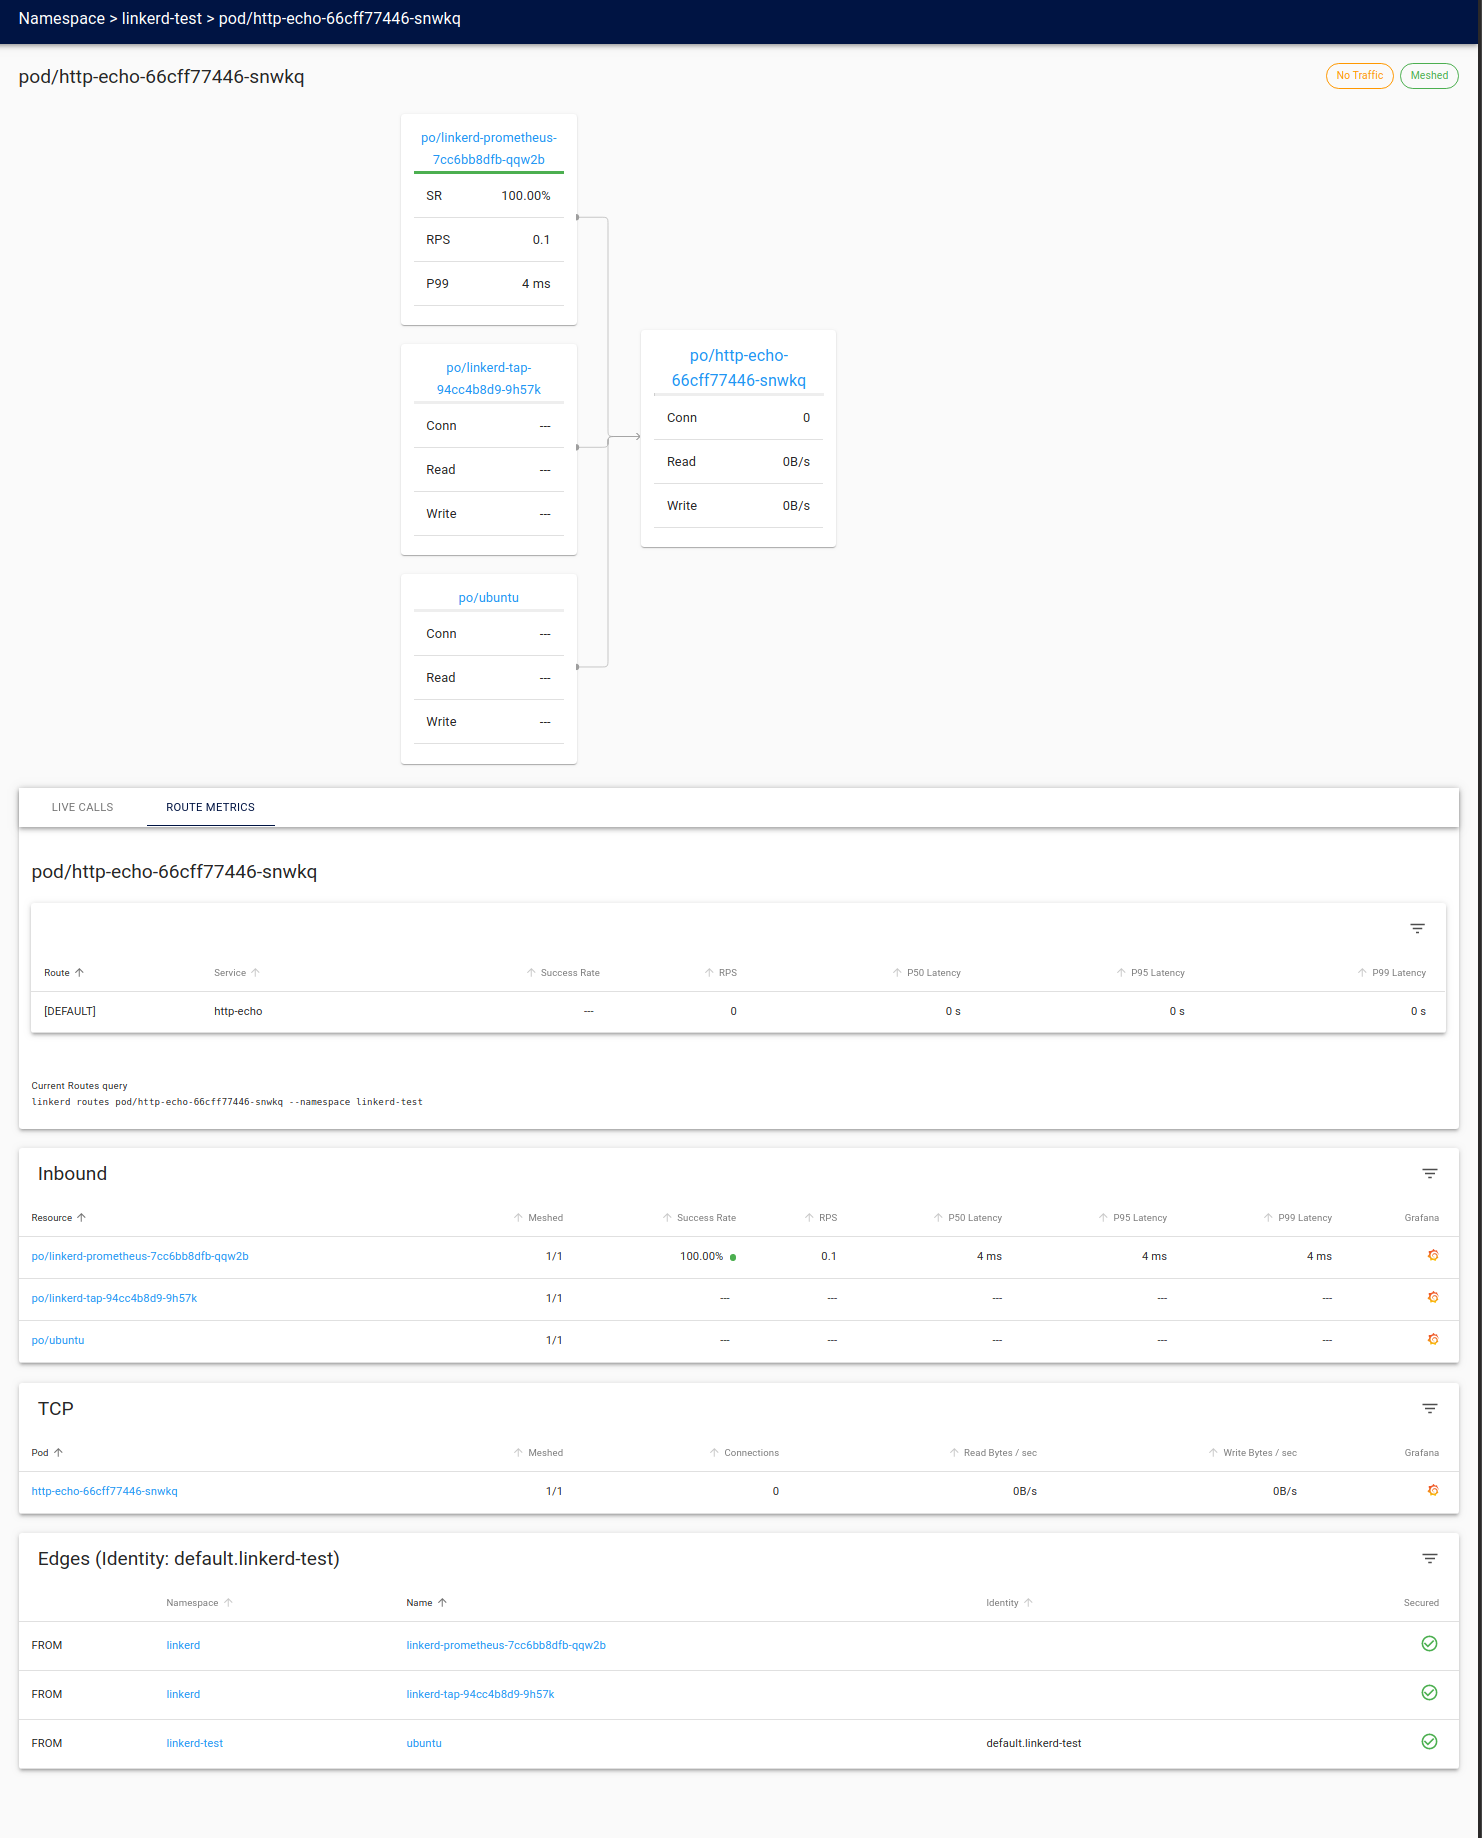
Grafana metrics
We can view the service mesh metrics by clicking the in the last column to open up the corresponding pod's metrics dashboard.
Ubuntu metrics
Here we see the metrics captured by the service mesh for the ubuntu pod.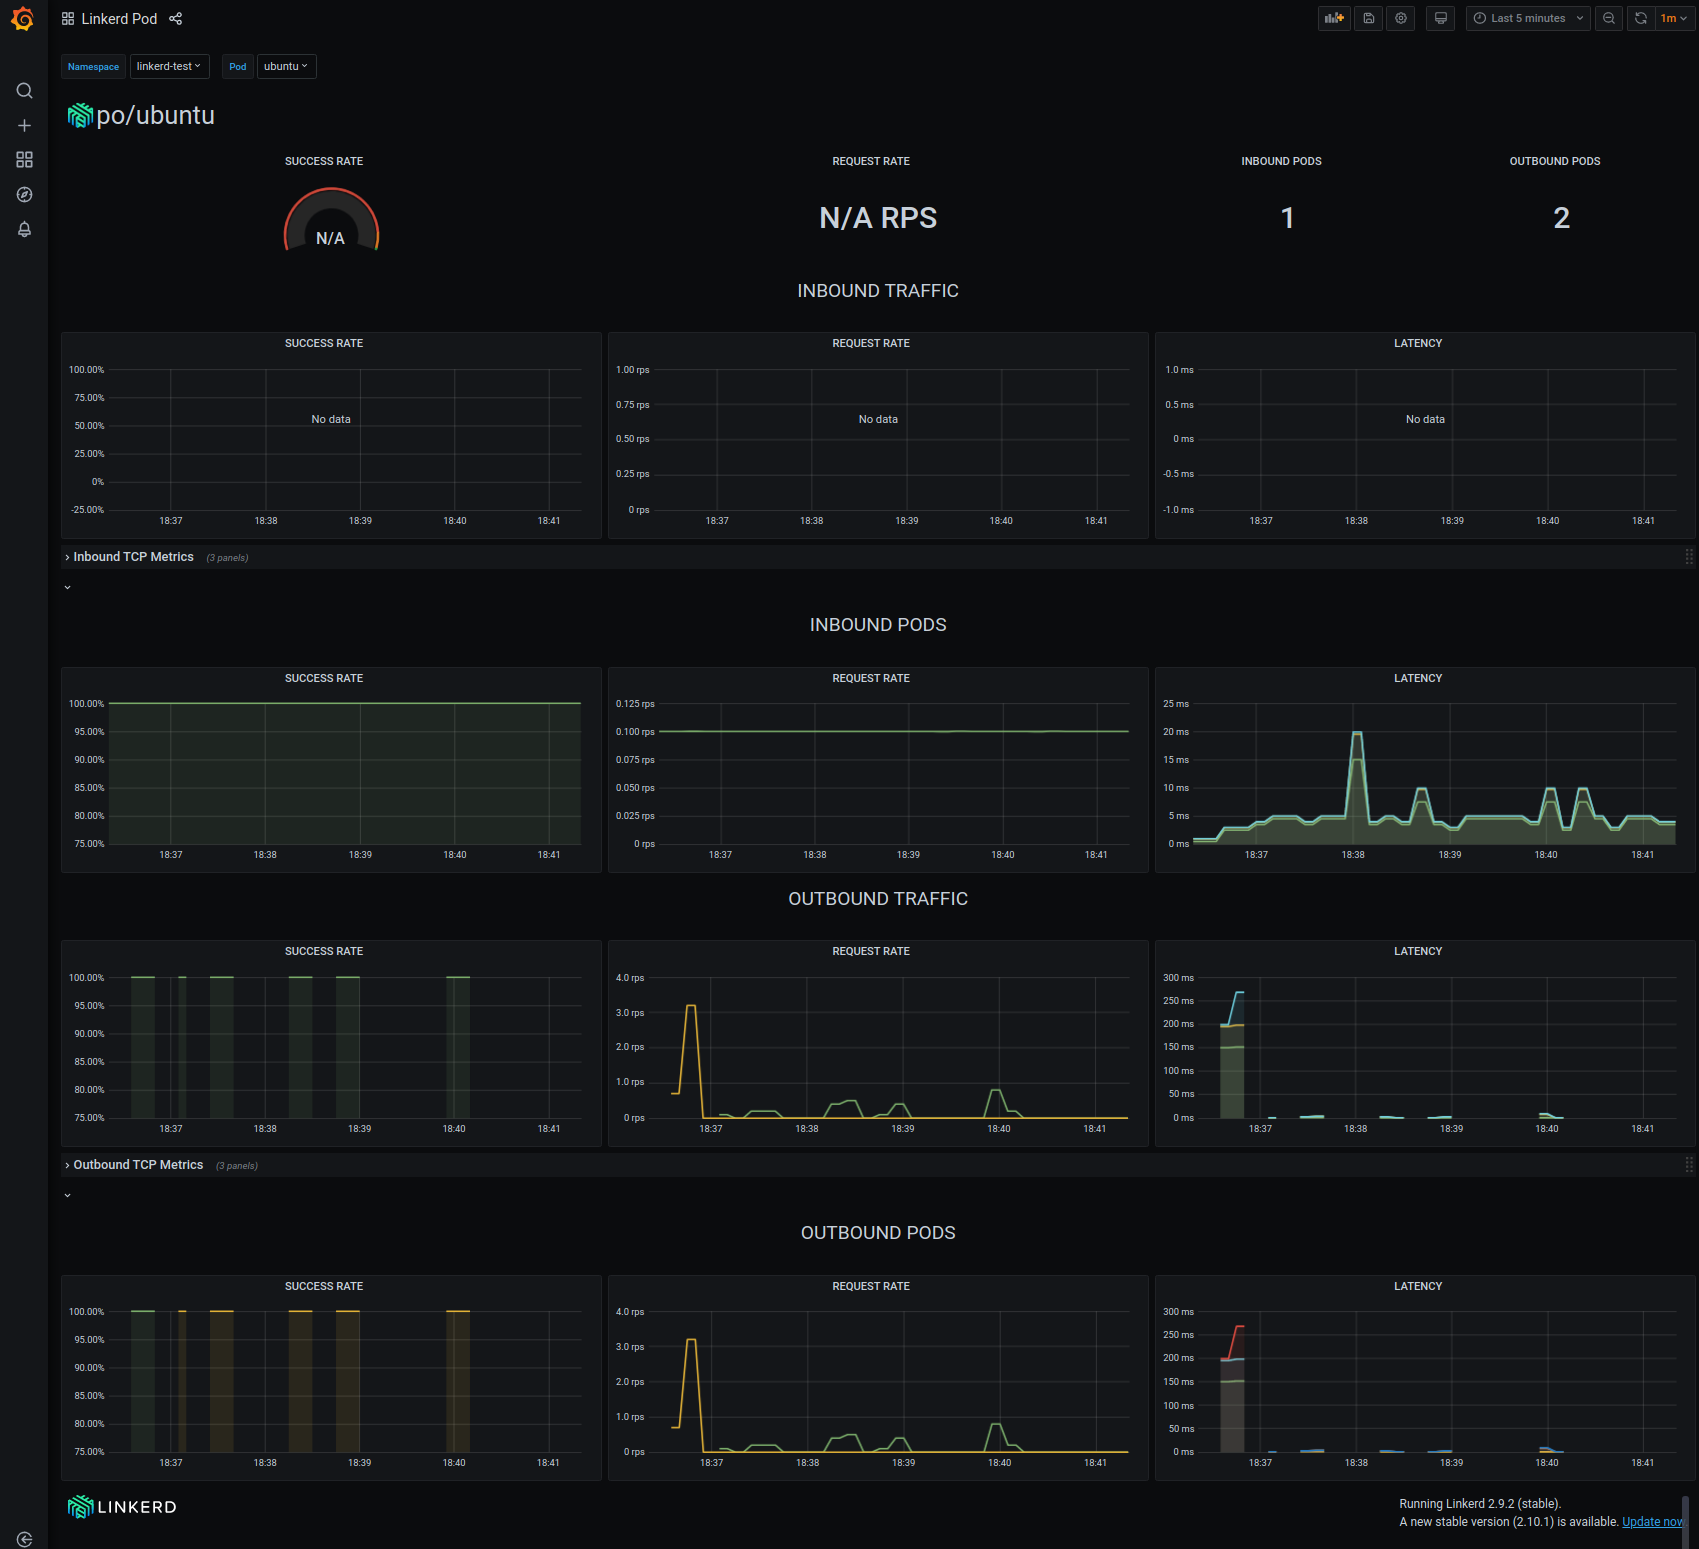
Notice that all the traffic is outbound. This is as expected, considering the traffic originates from our curl calls to the http://http-echo service. We can see that we have a 100% success rate for all outbound requests. The dashboard also visually illustrates the activity with the request rate, and traffic latency metrics.
Http-Echo metrics
Here we see the metrics captured by the service mesh for the http-echo pod.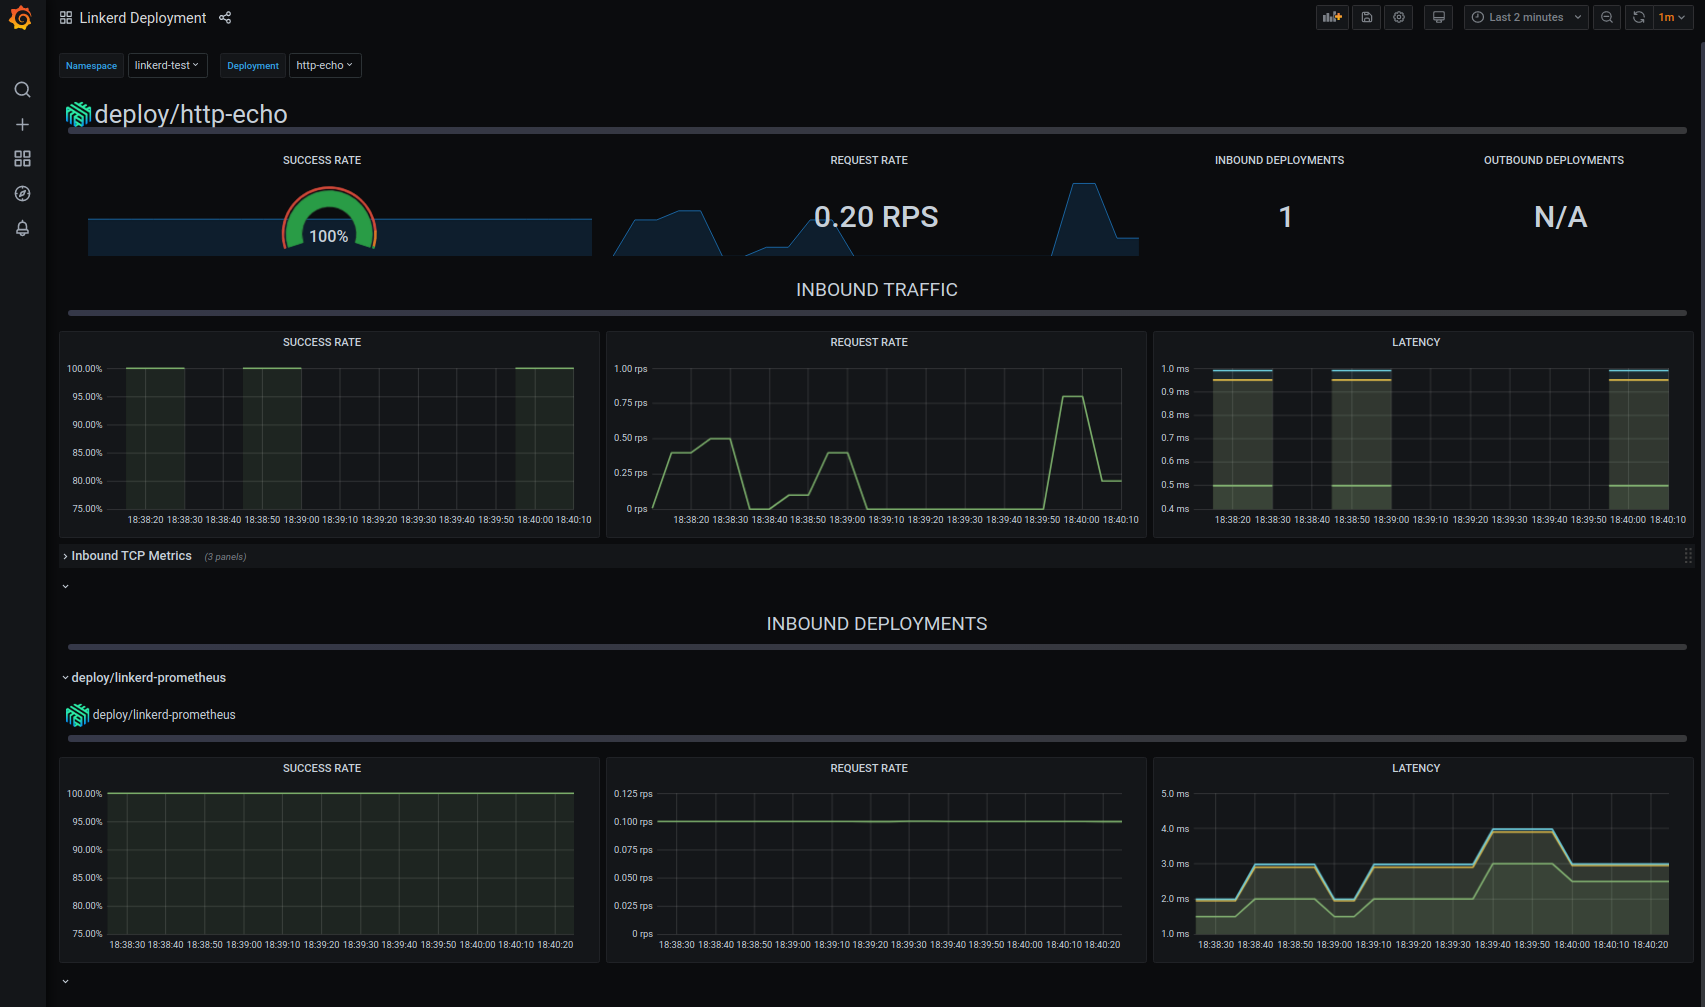
The dashboard displays the inbound traffic originating from the ubuntu pods curl calls we made earlier. Again, Again, we can see that we have a 100% success rate for all inbound connections. Also displayed are the request rate and traffic latency metrics.

Twitter
Facebook
Reddit
LinkedIn
Email