Introduction
In previous articles, we have seen the importance of service log aggregation to understand and troubleshoot our services. In this article, we will build the Telemetry Service, which provides an endpoint for logging data captured from its clients. Data collected by the service is persisted in its own MongoDB database to support client troubleshooting and usage analysis. The TelemetryService serves two primary functions, log client application events, and query client application events.Requirements
Before you get started, you will need the following:- Java
- Maven
- Docker
- Docker-Compose
Building the Telemetry Service

The TelemetryService provides a REST endpoint where application clients can log telemetry event data. In addition to the telemetry data, application clients supply the user's account id and the application client type ( source) with each event to enable diagnostics and analytics across browser, mobile, and IOT application clients and users.
The source
Maven pom.xml
loading...Service Configuration
bootstrap.yml
loading...Not much different in this bootstrap file except for the spring.application.name
appliction.yml
loading...Client Logging Telemetry Controller
loading...The ClientLoggingTelemetryController provides the REST endpoint for our service implementation. Is exposes four methods:
- /level- returns the current client logging level for the given account id.
- /log- adds the logging event.
- /event/{id}- retrieves the event with the specified id.
- findByAccountId- returns a paged list of client telemetry data for the given account id.
Client Telemetry Event model
loading...The ClientTelemetryEvent model represents a client application logging event.
- Source represents the application client type. This value allows us to differentiate what type of client originated the event.
- accountId identifies the authenticated user that was logged into the client when the event was generated.
- level identifies the logging level associated with the event.
- message is generally used to provide a simple, human readable message indicating the nature of the event.
- details provides an array of messages that usually map to a client-side stacktrace or a collection of client-side metadata.
Client Telemetry Event Service
loading...The ClientTelemetryEventService expose four public methods:
- create-persists a new telemetry event in the backing store.
- find-retrieves a telemetry event by its event id.
- delete-deletes a telemetry event using its event id.
- findByAccountId-returns a paged collection of telemetry events. The collection can be presorted by attribute, and constrained by ZonedDateTime range, logging level, and accountId.
Docker Compose
We continue the process of extending our Docker-Compose file. Here we include our Telemetry Serviceloading...Telemetry Service In Action
We can copy the Docker-Compose file above to your local machine and run it from the command prompt:docker-compose -f ./dc-11-telemetry.yml up -d
Exercising the Swagger Interface
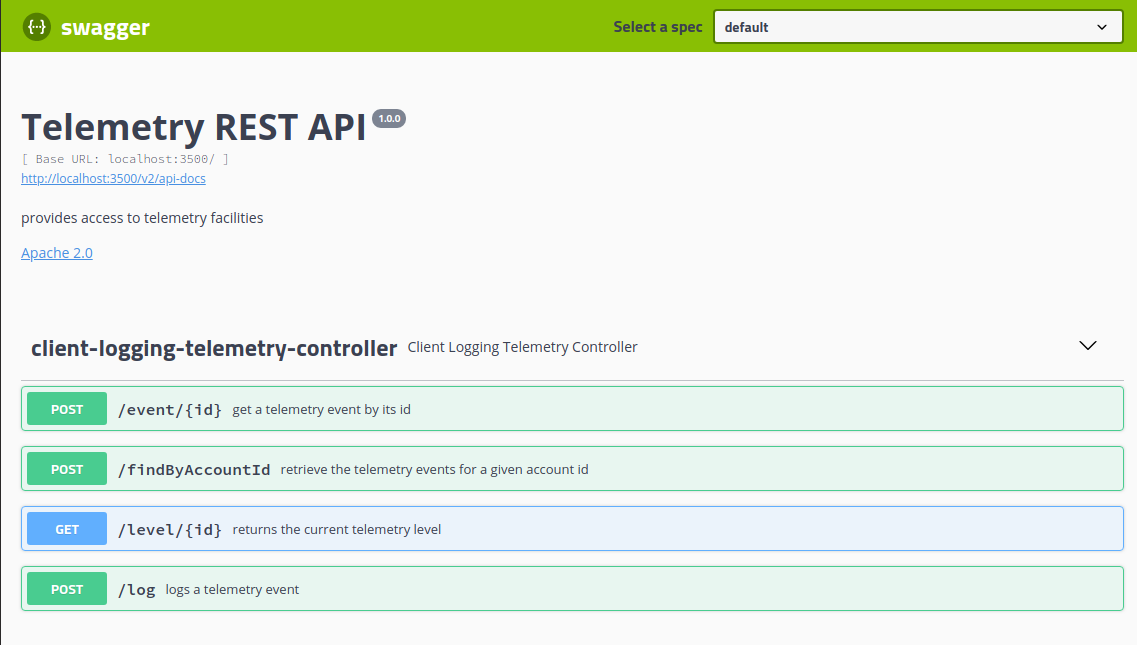
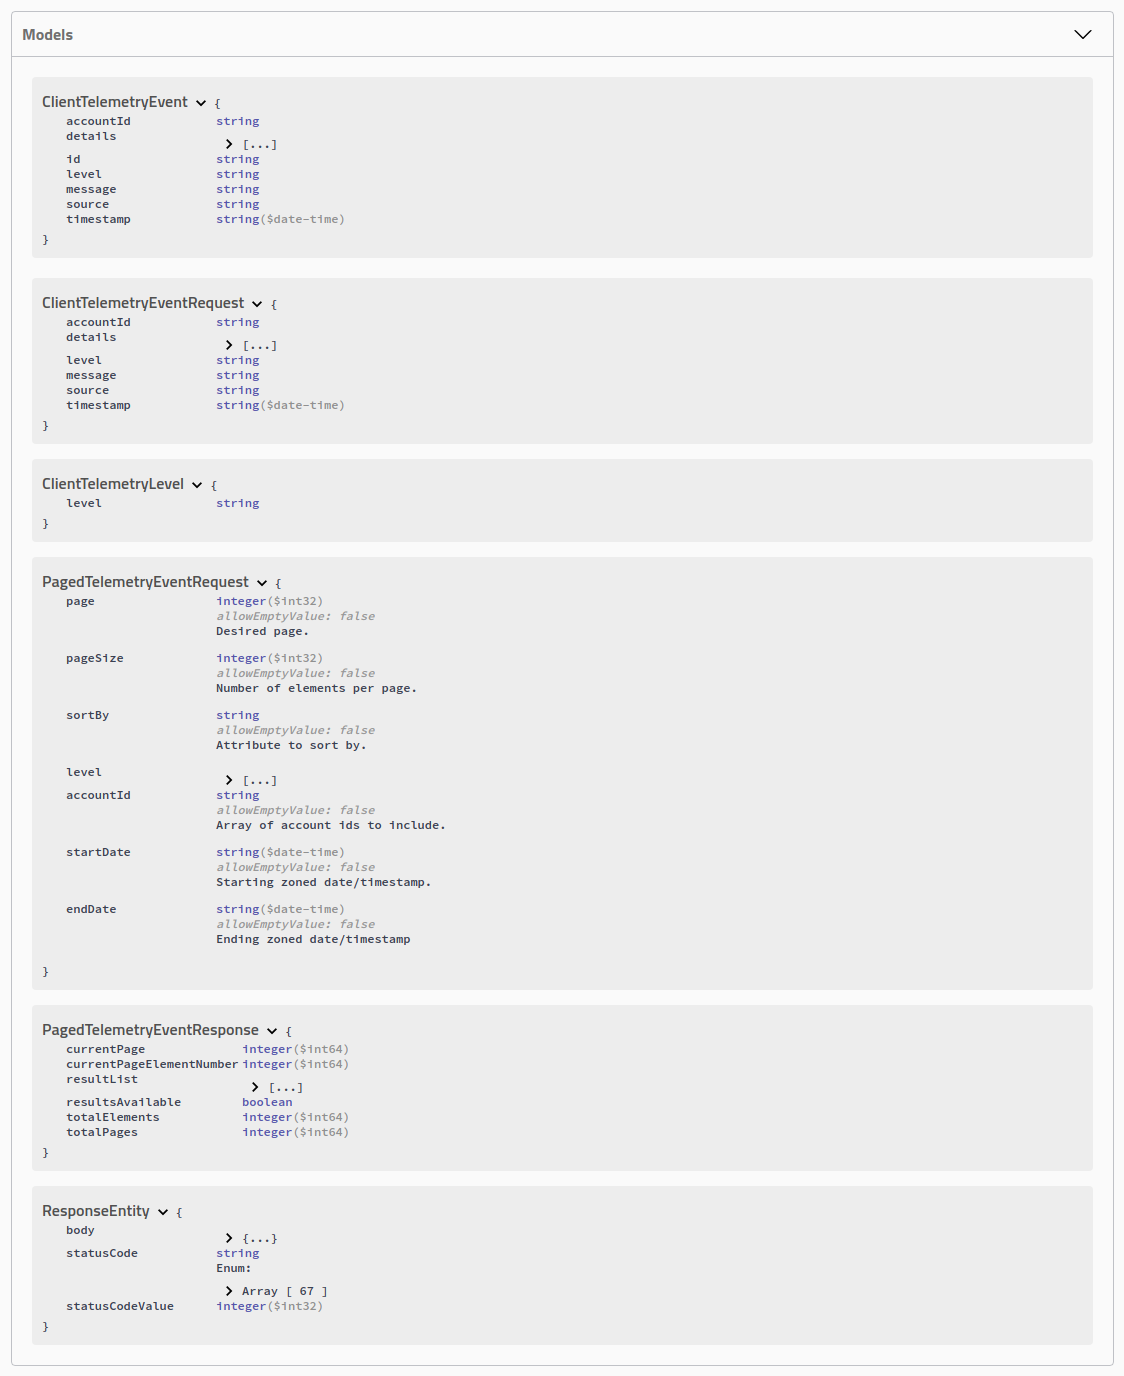
Once all the services have started, navigate to the following url: http://localhost:3500/swagger-ui.html, and you should arrive at the Telemetry Service REST API page. The page is composed of the Telemetry Service methods and the models they use.Telemetry Service methods
Telemetry Service models
level/{id} method
We will start with level/{id} method since the application client needs to call it to determine the current logging level.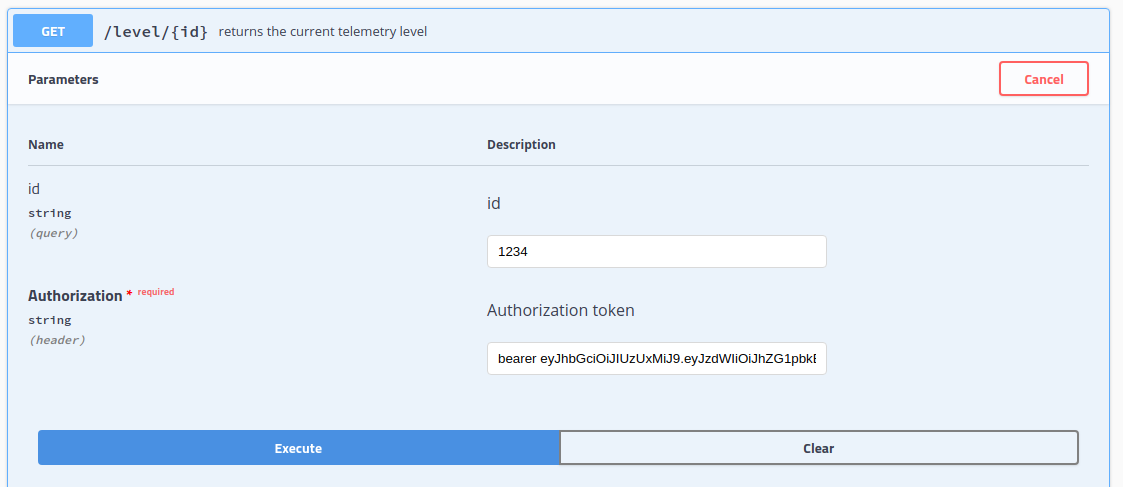
This method requires an account id and a valid authentication token. By passing in the account id we can provide a custom telemetry level for individual clients. However, the current implementation does not use this value.

The response contains the telemetry level (currently returning INFO). In principle, the level instructs the client the highest degree of event granularity it should send to the service. If we aren't interested in fine-grain telemetry events (e.g., debugging events), this can significantly reduce the volume of data sent from the client to the service.
log method
The most common method called will be the log method. This method allows an application client to post a telemetry event to the service.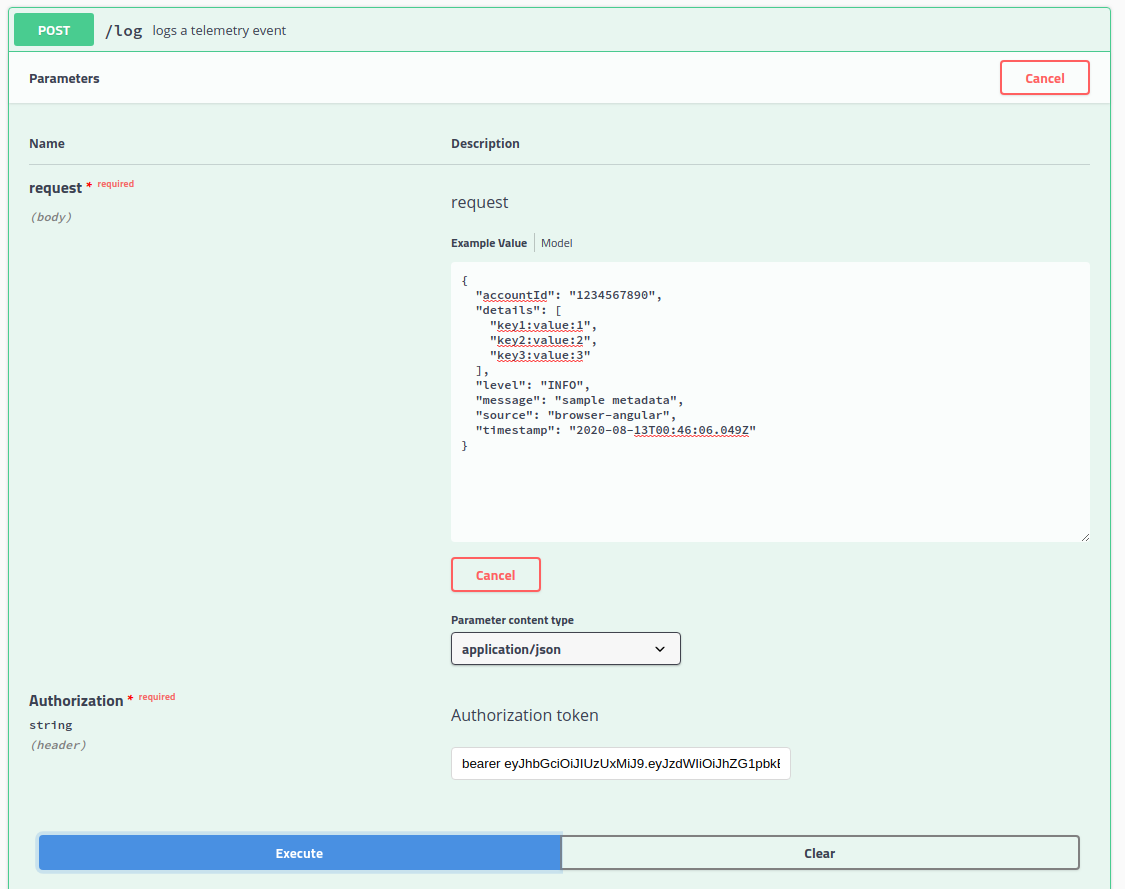

find by account id method
An application client will rarely call the findByAccountId method. However, it is called by the AdministrationService to retrieve client telemetry data.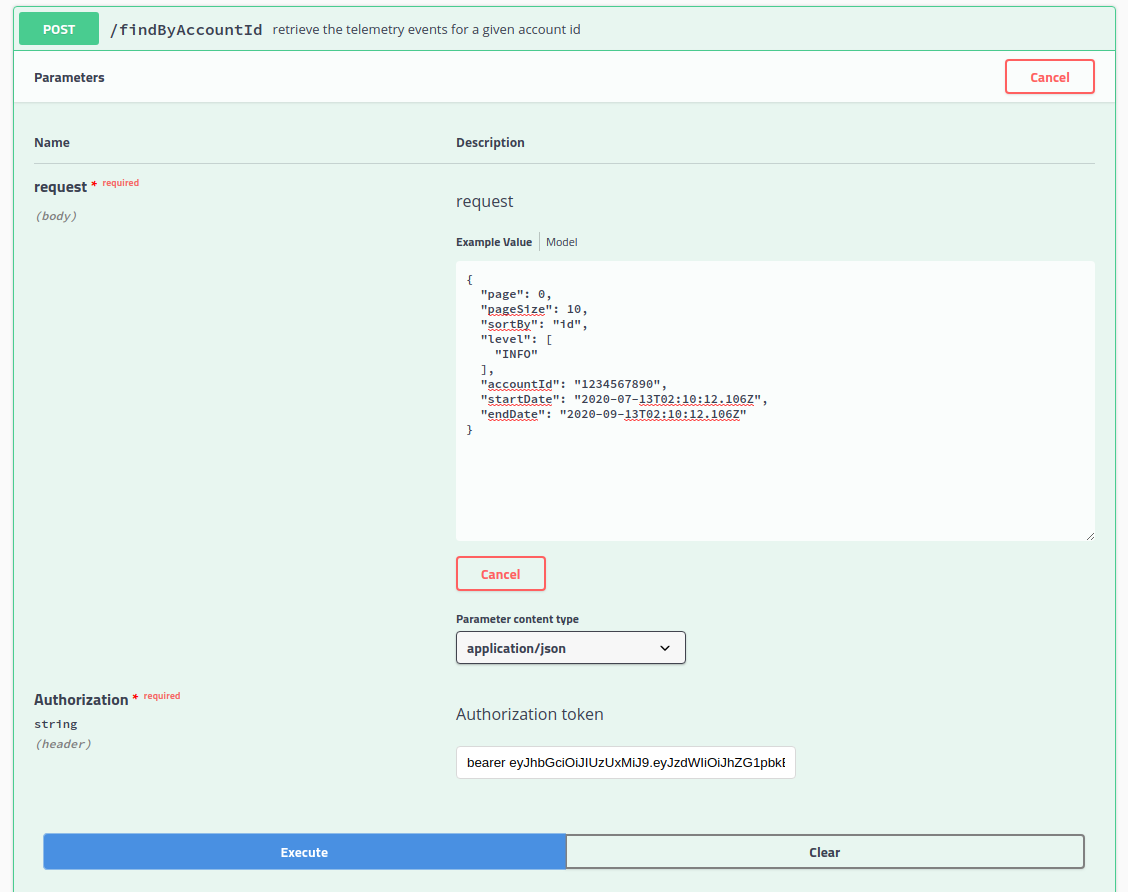
Here we pass in the page number and size, the accountId, sort by event id, and constrain the query by level ( INFO), and date range.
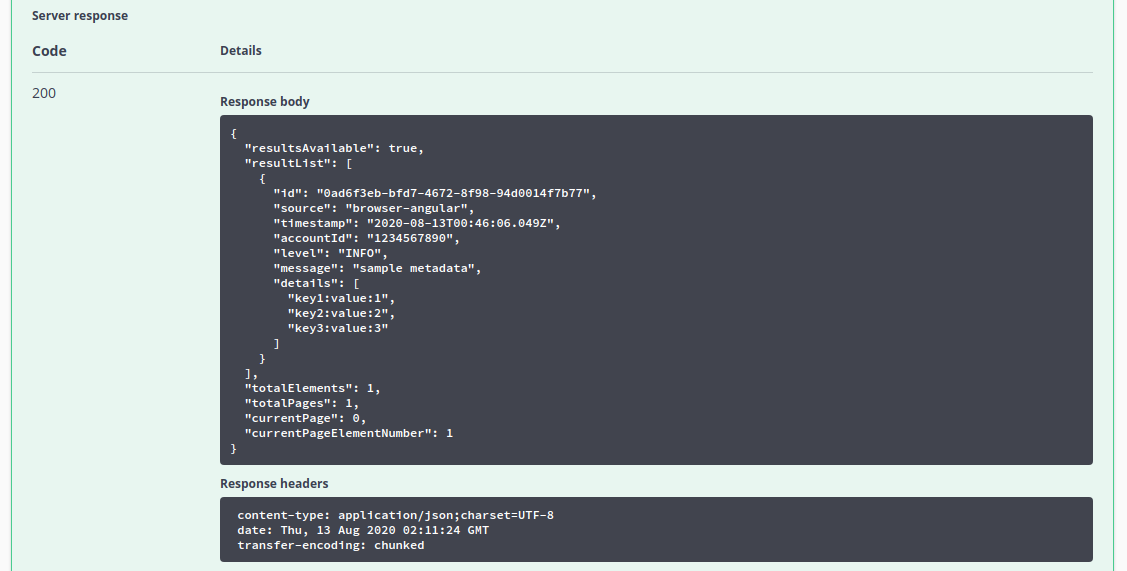
Here we see a paged response containing a single telemetry event.
event/{id} method
The last method is event/{id}. This method will retrieve a given event based on its id. This method would rarely be called from an application client.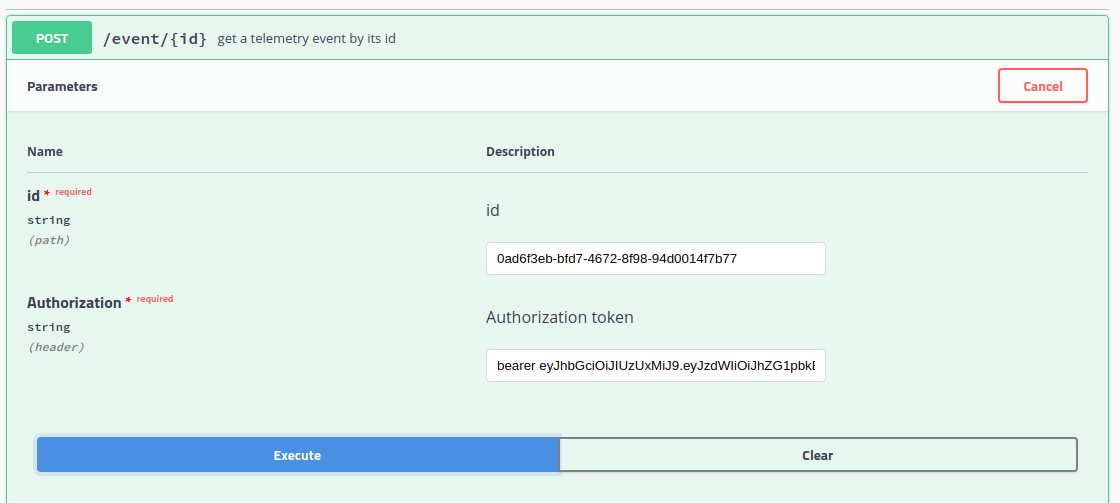
Here we pass in the page number and size, the accountId, sort by event id, and constrain the query by level( INFO), and date range.
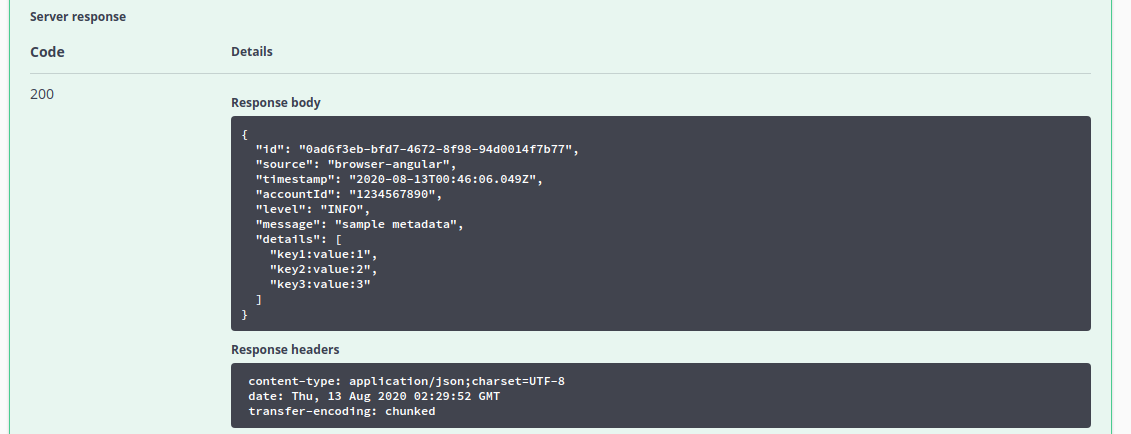
Here we see the singular telemetry event we requested.
Metrics and Monitoring
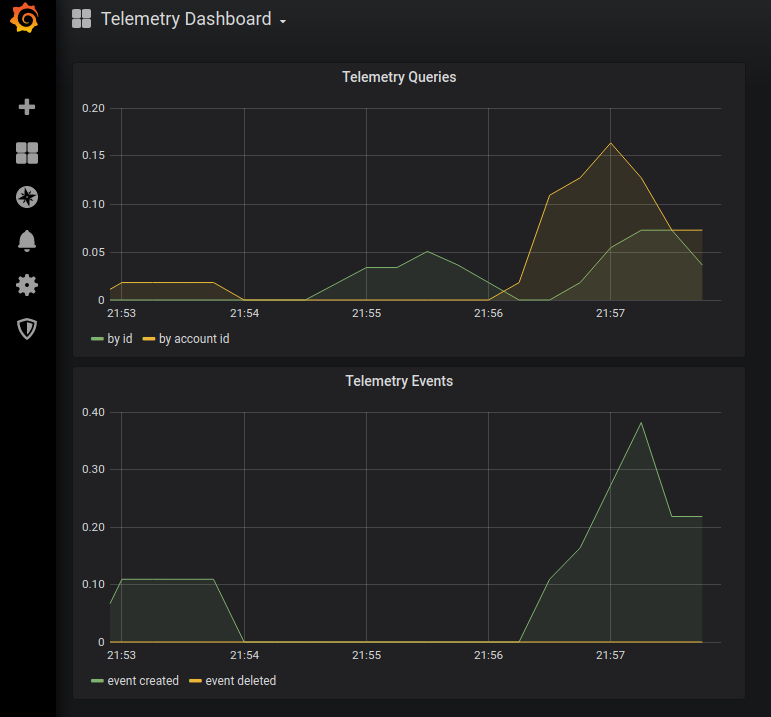
The Telemetry Service generates the following service-level metrics:- telemetry.query.id.total
- telemetry.query.account.total
- telemetry.event.created.total
- telemetry.delete.total
To visualize this data we will import the TelemetryDashboard.json file from the ThinkMicroservices Github Dashboards repository. The dashboard should appear as:
Resources
- TelemetryService Github repository
- TelemetryService Docker Hub image.
- ThinkMicroservice TelemetryService Dashboard

Twitter
Facebook
Reddit
LinkedIn
Email